CHAPTER 4: OBJECTIVE 3, DETERMINE THE DIFFERENCES IN DEMOGRAPHIC DATA, TEST BATTERY RESULTS, AND PERFORMANCE-BASED MEASURES BETWEEN INATTENTIVE AND ATTENTIVE DRIVERS. HOW MIGHT THIS KNOWLEDGE BE USED TO MITIGATE THE POTENTIAL NEGATIVE CONSEQUENCES OF INATTENTIVE DRIVING BEHAVIORS? COULD THIS INFORMATION BE USED TO IMPROVE DRIVER EDUCATION COURSES OR TRAFFIC SCHOOLS?
For this research objective, statistical analyses were conducted using the frequency of drivers’ involvement in inattention-related crashes and near-crashes compared to each driver’s composite test battery score or relevant survey response (Table 4.1). The debrief form and the health assessment questionnaires were not included as they are not personality assessment tests. A discussion of how these results could be used to mitigate potential negative consequences of inattentive driving and/or used in traffic schools and drivers education courses will also be addressed in this chapter.
Table 4.1. Description of questionnaire and computer-based tests used for 100-Car Study.
|
Name of Testing Procedure |
Type of Test |
Time test was administered |
Brief description |
|---|---|---|---|---|
1. |
Driver demographic information |
Paper/pencil |
In-processing |
General information on drivers age, gender, etc. |
2. |
Driving History |
Paper/pencil |
In-processing |
General information on recent traffic violations and recent collisions. |
3. |
Health assessment questionnaire |
Paper/pencil |
In-processing |
List of variety of illnesses/medical conditions/or any prescriptions that may affect driving performance. |
4. |
Dula Dangerous Driving Index |
Paper/pencil |
In-processing |
One score that describes driver's tendencies toward aggressive driving. |
5. |
Sleep Hygiene |
Paper/pencil |
In-processing |
List of questions that provide information about driver's general sleep habits/substance use/sleep disorders. |
6. |
Driver Stress Inventory |
Paper/Pencil |
In-processing |
One score that describes the perceived stress levels drivers experience during their daily commutes. |
7. |
Life Stress Inventory |
Paper/pencil |
In-processing/Out-processing |
One score that describes drivers stress levels based upon the occurrence of major life events. |
8. |
Useful Field-of-View |
Computer-based test |
In-processing |
Assessment of driver's central vision and processing speed, divided and selective attention. |
9. |
Waypoint |
Computer-based test |
In-processing |
Assessment of the speed of information processing and vigilance. |
10. |
NEO-FFI |
Paper/pencil |
In-processing |
Personality test. |
11. |
General debrief questionnaire |
Paper/pencil |
Out-processing |
List of questions ranging from seatbelt use, driving under the influence, and administration of experiment. |
DATA INCLUDED IN THESE ANALYSES
For the analyses in this chapter, crashes and near-crashes only will be used (incidents will be excluded from the analyses). In Dingus et al., (2005) the analyses indicated that the kinematic signatures of both crashes and near-crashes were nearly identical; whereas the kinematic signature of incidents were more variable. Given this result and to increase statistical power, the data from both crashes and near-crashes will be used in the comparison of questionnaire data to the frequency of driver involvement in inattention-related crashes and near-crashes.
Note that inattention-related crashes and near-crashes are defined as those events that involve the driver engaging in complex, moderate, or simple secondary tasks or driving while drowsy. Please note that in Chapter 2, driving-related inattention to the forward roadway was determined to possess a protective effect and therefore was removed from the definition of driving inattention. Non-specific eyeglance away from the forward roadway was also shown to not be significantly different from normal, baseline driving; therefore, these events were also removed from the analysis.
ASSIGNMENT OF INVOLVEMENT LEVEL FOR DRIVERS
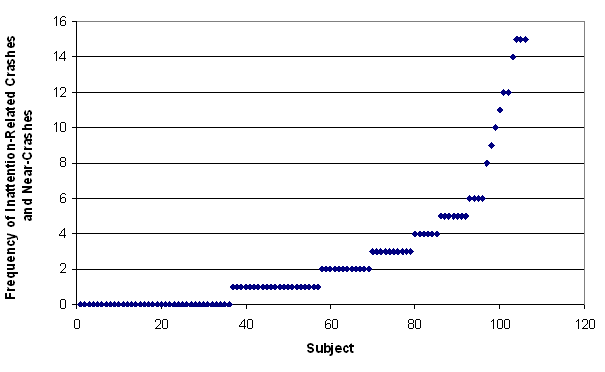
The first step to conduct the analyses for this research objective is to logically split the subjects into groups of involvement in inattention-related crashes and near-crashes. Figure 4.1 shows the distribution of all of the primary drivers and the frequency of involvement in inattention-related crashes and near-crashes for this study. The median and mean levels are marked on the figure. Note that there are 36 primary drivers who were not involved in any inattention-related crashes or near-crashes. The rest of the primary drivers were involved in 1 to 15 inattention-related crashes and/or near-crashes.
The mean frequency value was used to separate the drivers into two groups: those drivers who had “high involvement” in inattention-related crashes and near-crashes and those drivers who had “low involvement” in inattention-related crashes and near-crashes. Therefore, any driver who was involved in four or more inattention-related crashes and/or near-crashes was labeled as “high involvement” and drivers who were involved in fewer than four inattention-related crashes and/or near-crashes were labeled as having “low involvement.” A separate secondary analysis where the drivers were separated into three levels of involvement will be discussed at the end of this chapter.
Figure 4.1. The frequency of inattention-related crashes and near-crashes by driver in order from low frequency to high frequency.
While it is apparent that there are several ways to define “high” and “low” levels of involvement in inattention-related crashes and near-crashes, using the mean as a dividing point has been used by many other researchers, and given the exploratory nature of these analyses, it provides a fairly conservative measure upon which to divide the drivers, yet still preserves any differences that may exist between those drivers who have tendencies to be involved in frequent inattention-related crashes and near-crashes and those who exhibit fewer tendencies. Table 4.2 provides the descriptive statistics for the drivers’ respective group divisions.
This chapter will first present results using t-tests and correlations to describe any demographic or test battery score differences that exist between drivers with high and low involvement in inattention-related crashes and near-crashes. A separate analysis using analysis of variance and correlations will then be conducted to describe any demographic or test battery differences among high, moderate, and low involvement in inattention-related crashes and near-crashes. Given that these analyses are exploratory in nature, two analyses were conducted to provide a thorough investigation of the demographic and test battery scores for these drivers. Finally, a logistic regression analysis will be presented to assess the predictability of any of these demographic data or test battery scores. After these analyses, a discussion on the usefulness of these test batteries for mitigating distracted driving as well as suggestions for improving driver education programs will be presented.
Table 4.2. Descriptive statistics on drivers labeled “high involvement” and “low involvement” in inattention-related crashes and near-crashes.
Statistic |
High Involvement |
Low Involvement |
|---|---|---|
Number of drivers |
27 |
78 |
Mean (# of Inattention-Related Crashes and Near-crashes) |
7.6 |
0.95 |
Median |
6 |
1 |
Mode |
5 |
0 |
Standard deviation |
3.9 |
1.1 |
Minimum |
4 |
0 |
Maximum number of events |
15 |
3 |
Number of crashes |
25 |
14 |
Number of near-crashes |
179 |
61 |
ANALYSIS ONE: T-TEST ANALYSIS FOR THE “LOW AND HIGH INVOLVEMENT IN INATTENTION-RELATED CRASHES AND NEAR-CRASHES”
The list of driver self-reported demographic data and survey data is shown in Table 4.3.
Table 4.3. Driver self-reported demographic data summary.
|
Demographic/Survey Data |
Information Presented |
|---|---|---|
1. |
Driver Demographic Information |
Age |
2. |
Driving History |
Number of traffic violations in past 5 years |
3. |
Health Assessment |
Frequency of health conditions |
4. |
Sleep Hygiene |
Daytime sleepiness scale |
Drivers reported their respective demographic data, driving history (e.g., number of citations received in the past 5 years), health status, and sleep hygiene using four separate surveys. T-tests were conducted to determine if any statistical differences existed between the inattentive and attentive drivers. A complete listing of all t-tests and ANOVA tables is in Appendix D.
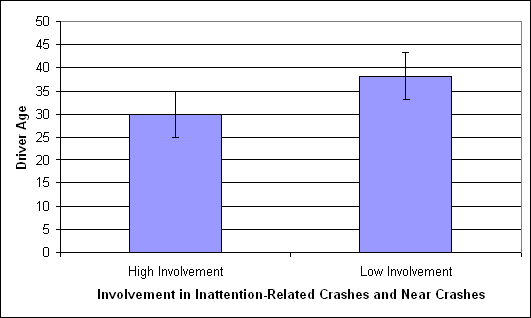
Driver Age. Figure 4.2 shows the average age of the high- and low- involvement drivers. A t-test was conducted to determine whether there were significant differences in age between groups. The results suggest that the high-involvement drivers were significantly younger than the low-involvement drivers, t (102) = 7.07, p = 0.009.
Figure 4.2. Average age of the high- and low-involvement drivers in inattention-related crashes and near-crashes.
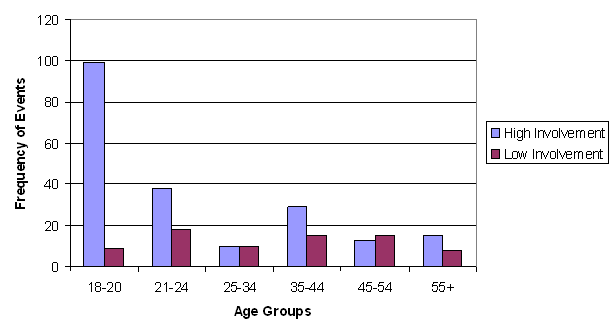
To determine whether particular age groups were more likely to drive while inattentive, the drivers were split up into six age groups and the number of events for each group was calculated and plotted in Figure 4.3. Results from a chi-square statistical test indicated that the 18- to 20-year-old drivers had significantly more inattentive events than did any of the other age groups: X (5) = 39.93, p > 0.01.
Figure 4.3. The frequency of inattention-related crashes and near-crashes for each age group by involvement group.
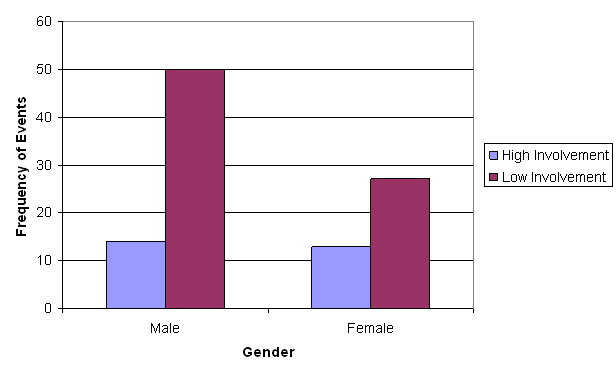
Gender. An analysis of the gender make-up of both the high- and low-involvement drivers was also conducted. Note that 60.6 percent of all primary drivers were male and 39.4 percent were female. The breakdown for high- and low-involvement drivers is shown in Figure 4.4. Males were involved in more crashes and near-crashes than were the female drivers. However, it appears that the female drivers were involved in a higher percentage of inattention events than were the male drivers. This suggests that when females are involved in crashes and near-crashes, they are more likely to be inattention-related. Males, on the other hand, have a higher rate of crash and near-crash involvement but a slightly lower likelihood of inattention serving as a contributing factor.
Figure 4.4. Gender breakdown of high-involvement drivers.
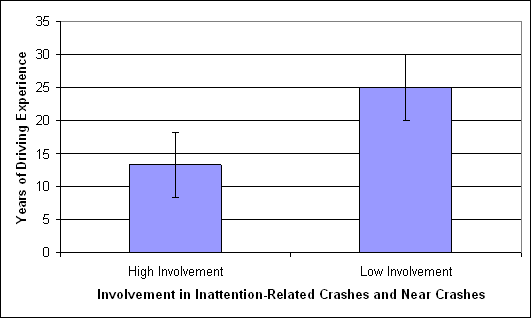
Years of Driving Experience. An analysis of the number of years of driving experience was also conducted. Figure 4.5 shows that high-involvement drivers had fewer years of driving experience than did the low-involvement drivers. Again, a t-test was conducted and the results suggest that the high-involvement drivers had significantly fewer years of experience than did the low-involvement drivers: t(99) 7.6, p = 0.007. Given that drivers in the United States generally receive their driver’s licenses at age 16, this result is most likely correlated with age.
Figure 4.5. Average years of driving experience for drivers with high- and low-involvement in inattention-related crashes and near-crashes.
Drowsiness. Drivers were administered an abbreviated version of the Walter Reed Sleep Hygiene Questionnaire to assess their sleep habits. An abbreviated version was used to reduce the amount of time required of drivers during in-processing. There were 31 questions on this abbreviated questionnaire. This questionnaire was not designed to provide one composite score or rank driver drowsiness on several scales. Therefore, to explore the relevance of this questionnaire to inattention-related events, two of the questions have been identified as the most representative of the entire questionnaire. These two questions are:
- Rank <on a scale of 1 to 10> the extent to which you currently experience daytime sleepiness?
- How many hours do you sleep <per night>?
Daytime Sleepiness. The average scores that the high- and low-involvement drivers provided when rating their daytime sleepiness levels on a scale from 1 to 10 indicated that high-involvement drivers rated themselves slightly higher (i.e., more sleepy) than the low-involvement drivers (inattentive = 4.8, attentive drivers = 3.9). While this result was not significant, the t-value approached significance: t (99) = 3.6, p = 0.06.
Hours of Sleep. An analysis of the average number of hours of sleep experienced by high- and low-involvement drivers was also conducted. Both high- and low-involvement drivers’ average hours of sleep reported were 7.0 hours, which was not significant. Given that no significant results were obtained for these two questions, no further analyses using this questionnaire were conducted.
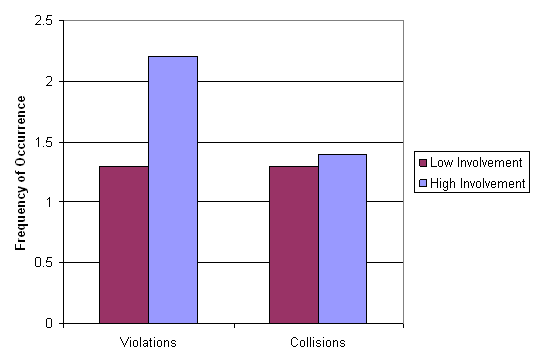
Number of Traffic Violations. All drivers were asked to report the number of traffic-violation citations that they had received during the 5 years prior to the start of the 100-Car Study. This self-reported value was analyzed by comparing the number of high-involvement driver violations to low-involvement driver violations. Figure 4.6 shows that high-involvement drivers had a higher average number of violations than did the low-involvement drivers. A t-test was conducted which resulted in a significant finding, t(101) 4.9, p = 0.03.
Number of Collisions. All drivers were also asked to report the number of collisions that they had been involved during the 5 years prior to the start of the study. Figure 4.6 also shows that high-involvement drivers reported involvement in only slightly more collisions than the low-involvement drivers. This result was not significant at a 0.05 probability level.
Figure 4.6. Self-reported involvement in traffic violations and collisions for 5 years prior to the onset of the 100-Car Study.
Table 4.4 provides a list of the test batteries that were administered to the drivers either prior to the onset of the study or at the completion of the study. Analyses of each of these test batteries will follow.
Table 4.4. Test battery names and scores.
Test Battery Name |
Test Battery Score |
|---|---|
Life Stress Inventory |
|
Driver Stress Inventory |
|
Dula Dangerous Driving Inventory |
|
NEO Five Factor Inventory |
|
Life Stress Inventory. The Life Stress Inventory was administered to the drivers after data collection as the entire questionnaire instructed the drivers to record life stressors experienced during the past 12 months, which corresponded to the duration of data collection. A composite score was then calculated based upon the type of stressors that each driver experienced and an overall life stress score ranged from 0 to 300. Unfortunately, only 65 primary drivers returned after data collection to complete this questionnaire.
T-tests were conducted to determine whether the overall Life Stress Inventory scores were significantly different between the high- and low-involvement drivers. No significant differences were observed as both groups scored in the low stress level category (high-involvement = 154.6 and low-involvement = 125.4). Other descriptive statistics of the Life Stress Inventory are provided in Table 4.5. Note that the highest Life Stress Score was for a low-involvement driver.
Table 4.5. Life Stress Inventory descriptive statistics.
Statistic |
High Involvement |
Low Involvement |
|---|---|---|
N |
15 |
50 |
Mean |
154.6 |
125.4 |
Standard Deviation |
104.1 |
113.0 |
Driver Stress Inventory. The Driver Stress Inventory was developed by Matthews, Desmond, Joyner, Carcary, and Gilliland (1996) to assess an individual driver’s vulnerability to commonplace stress reactions while driving, such as frustration, anxiety, and boredom. The five driver stress factors that the Driver Stress Inventory assesses are (1) aggression, (2) dislike of driving, (3) hazard-monitoring, (4) thrill-seeking, and (5) fatigue proneness. Composite scores for each driver stress factor are provided. The Driver Stress Inventory was originally validated by correlating responses with driver’s self-report of violations and collisions, other driver behavior scales (Driver Coping Questionnaire) and the NEO Five-Factor Inventory. The Driver Stress Inventory has been used widely in transportation research.
T-tests were conducted to see whether any significant differences occurred for the high- and low- involvement drivers for each of the five driving stress factor scores. None of the t-tests indicated significant differences between driver groups. One possibility for this result is that these drivers are all urban and may all be fairly uniform on scales such as hazard monitoring and aggressive driving; therefore, no differences existed in this population for these driver assessment scales. Descriptive statistics for each of the five driver stress factors is provided in Tables 4.6 through 4.10 below. These results suggest that the Driver Stress Inventory scores for any of the five driver stress factors show no association with the occurrence of inattention-related crashes and near-crashes.
Table 4.6. Descriptive statistics on the drivers with high and low involvement in inattention-related crashes and near-crashes for the driver stress factor scale of aggression.
Statistic |
High Involvement |
Low Involvement |
|---|---|---|
N |
27 |
76 |
Mean |
48.5 |
46.4 |
Standard Deviation |
12.1 |
15.5 |
Table 4.7. Descriptive statistics on the drivers with high and low involvement in inattention-related crashes and near-crashes for the driver stress factor scale of dislike of driving.
Statistic |
High Involvement |
Low Involvement |
|---|---|---|
N |
26 |
76 |
Mean |
33.0 |
31.9 |
Standard Deviation |
10.1 |
10.3 |
Table 4.8. Descriptive statistics on the drivers with high and low involvement in inattention-related crashes and near-crashes for the driver stress factor scale of hazard monitoring.
Statistic |
High Involvement |
Low Involvement |
|---|---|---|
N |
27 |
76 |
Mean |
64.9 |
68.9 |
Standard Deviation |
11.2 |
11.8 |
Table 4.9. Descriptive statistics on the drivers with high and low involvement in inattention-related crashes and near-crashes for the driver stress factor scale of fatigue proneness.
Statistic |
High Involvement |
Low Involvement |
|---|---|---|
N |
26 |
76 |
Mean |
39.7 |
36.7 |
Standard Deviation |
13.6 |
13.1 |
Table 4.10. Descriptive statistics on the drivers with high and low involvement in inattention-related crashes and near-crashes for the driver stress factor scale of thrill-seeking.
Statistic |
High Involvement |
Low Involvement |
|---|---|---|
N |
27 |
75 |
Mean |
28.5 |
25.1 |
Standard Deviation |
16.6 |
16.3 |
Dula Dangerous Driving Inventory. The Dula Dangerous Driving Inventory provides a measure of a driver’s likelihood to engage in dangerous behaviors. While the scale maintained strong internal reliability, it was validated using a driving simulator and not any actual driving on a test track or on actual roadways (Dula and Ballard, 2003). The current analysis is one of the first analyses of this inventory using driving data on real roadways and in real traffic conditions. There are four scales that the Dula Dangerous Driving Index measures, these are (1) Overall Dula Dangerous Driving Index, (2) Negative Emotional Driving Subscale, (3) Aggressive Driving Subscale, and (4) Risky Driving Subscale.
T-tests were conducted on each of the four scales to determine whether high-involvement drivers had a significantly different likelihood of engaging in dangerous behavior than did the low-involvement drivers. No significant differences on any of the four scales were observed. The descriptive statistics for each of the four scales are presented in Tables 4.11 through 4.14.
Table 4.11. Descriptive statistics on the drivers with high and low involvement in inattention-related crashes and near-crashes for the Dula Dangerous Driving Scale for Dula Dangerous Driving Index.
Statistic |
High Involvement |
Low Involvement |
|---|---|---|
N |
27 |
77 |
Mean |
54.04 |
51.61 |
Standard Deviation |
10.46 |
11.42 |
Table 4.12. Descriptive statistics on the drivers with high and low involvement in inattention-related crashes and near-crashes for the Dula Dangerous Driving Scale Negative Emotional Driving Index.
Statistic |
High Involvement |
Low Involvement |
|---|---|---|
N |
27 |
77 |
Mean |
22.11 |
21.23 |
Standard Deviation |
4.59 |
4.9 |
Table 4.13. Descriptive statistics on the drivers with high and low involvement in inattention-related crashes and near-crashes for the Dula Dangerous Driving Scale Aggressive Driving.
Statistic |
High Involvement |
Low Involvement |
|---|---|---|
N |
27 |
77 |
Mean |
11.89 |
11.51 |
Standard Deviation |
4.15 |
3.78 |
Table 4.14. Descriptive statistics on the drivers with high and low involvement in inattention-related crashes and near-crashes for the Dula Dangerous Driving Scale Risky Driving.
Statistic |
High Involvement |
Low Involvement |
|---|---|---|
N |
27 |
77 |
Mean |
20.04 |
18.94 |
Standard Deviation |
3.88 |
4.48 |
NEO Personality Inventory -- Revised. The NEO Five-Factor Inventory is a five-factor personality inventory that obtains individual’s ranking on the following five scales: neuroticism, extraversion, openness to experience, agreeableness, and conscientiousness.
Extensive research has been conducted correlating the personality scales of neuroticism, extraversion, agreeableness, and conscientiousness to crash involvement (Arthur and Graziano, 1996; Fine, 1963; Loo, 1979; and Shaw and Sichel, 1971). While the hypothesis that drivers with certain personalities would more likely be involved in accidents seems reasonable, the results of this research are mixed. Some of the issues involved with these mixed results are that self-reported driving histories and driving behavior questionnaires have been correlated with personality scales but very little actual driving data has been used.
Neuroticism. The neuroticism scale is primarily a scale contrasting emotional stability with severe emotional maladjustment (depression, borderline hostility). High scorers may be at risk for some kinds of psychiatric problems (Costa and McCrae, 1992).
T-tests were conducted comparing the high- and low-involvement drivers. These results indicated that there were no significant differences with the low-involvement drivers obtaining mean scores of 26.7 and the high-involvement drivers obtaining a mean score of 20.6. The low-involvement drivers’ average score of 26.7 places them in the “high” neuroticism category on a scale from Very High (67-75) to Very Low (25-34). The high-involvement drivers average score placed them in the category of “Average” which ranged in scores from 14 to 21.
Extraversion. The extraversion scale is a scale that measures not only sociability but also assertiveness, general optimism and cheerfulness. People who score lower on this scale are not pessimists but rather prefer solitude, are generally more subdued in expressing emotion and demonstrate higher levels of cynicism (Costa and McCrae, 1992).
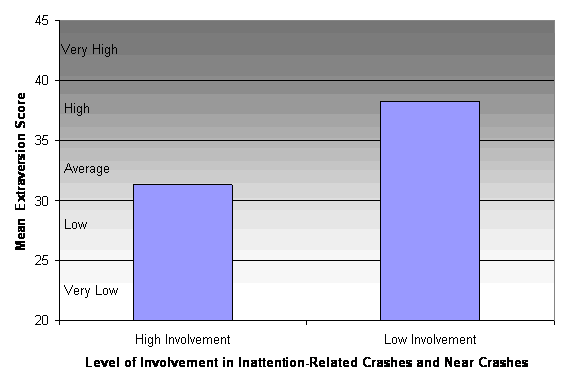
T-tests conducted on the extraversion scale showed that low-involvement drivers rated significantly higher than did the high-involvement drivers, t(103) = 7.03, p = 0.01. Figure 4.7 shows the two groups scores with high-involvement drivers ranking as “Average” and the low-involvement drivers ranking “High.”
Figure 4.7. Personality scores for the extraversion scale demonstrating significant differences between drivers with high and low involvement in inattention-related crashes and near-crashes.
Openness to Experience. The openness to experience scale is a measure of one’s willingness to explore, entertain novel ideas, and accept unconventional values. Those who score lower on this scale uphold more conventional values and are more conservative in action and beliefs. While some intelligence measures are correlated with scoring high on the “openness to experience” scale, this is not a measure of intelligence on its own (Costa and McCrae, 1992).
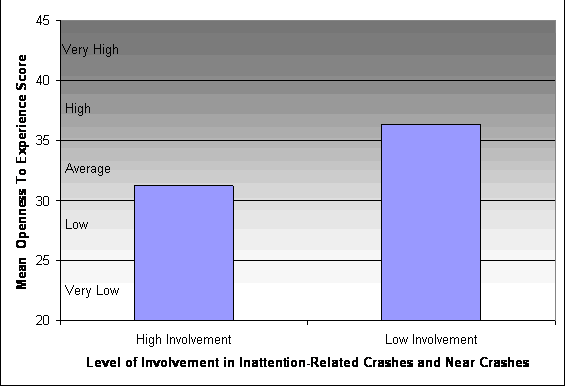
Results from a t-test on the Openness to Experience scale also revealed statistically significant differences between the high- and low-involvement drivers, t(103) = 4.03, p = 0.05. Figure 4.8 shows mean scores for both groups. These mean scores suggest that the high-involvement drivers scored in the “Average Openness to Experience Range” but that the low-involvement drivers scored in the high range.
Figure 4.8. Personality scores for the openness to experience scale demonstrating significant differences between drivers with high and low involvement in inattention-related crashes and near-crashes.
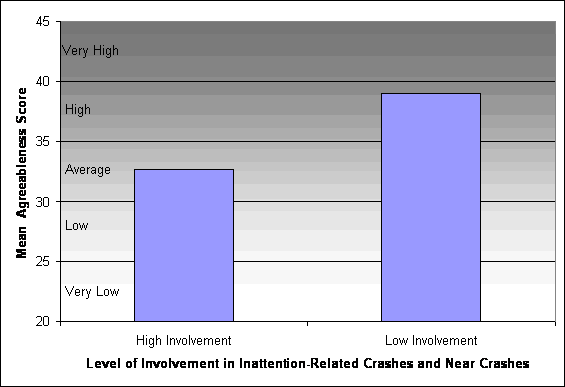
Agreeableness. The agreeableness scale is a measure of altruistic and sympathetic tendencies versus egocentric and competitive tendencies. Those drivers who score higher on this scale may be more concerned about the drivers in their vicinity while those who score lower may view driving more as a competition (Costa and McCrae, 1992).
The mean scores on the agreeableness scale for both high- and low-involvement drivers indicated that the low-involvement drivers scored significantly higher on the agreeableness scale than did the high-involvement drivers, t (102) = 8.26, p = 0.005. High-involvement drivers scored solidly in the middle of the “Average” range while the low-involvement drivers scored near the top of the “High” range (Figure 4.9).
Figure 4.9. Personality scores for the agreeableness scale demonstrating significant differences between drivers with high and low involvement in inattention-related crashes and near-crashes.
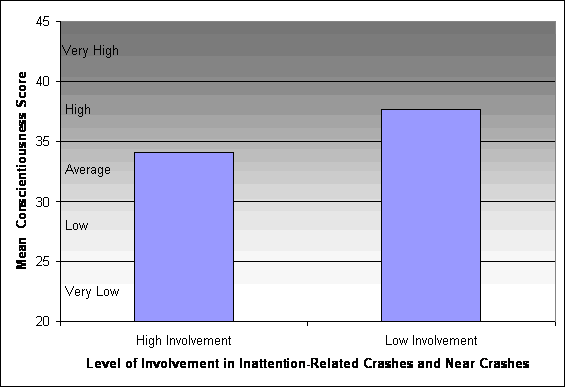
Conscientiousness. The conscientiousness scale is not as much a measure of self-control but of individual differences in the tendencies and abilities to plan, organize, and perform tasks. Highly conscientious individuals are purposeful, strong-willed, and highly determined individuals who generally fall into categories of highly skilled musicians or athletes. Individuals who score lower on this scale are not as driven to achievement of goals and while they may possess goals, are less likely to maintain schedules and practices that will result in the achievement of these goals (Costa and McCrae, 1992).
The mean conscientiousness scores for both high- and low-involvement drivers also resulted in significant differences, t (103) = 6.62, p = 0.01. The mean score for the high-involvement group indicated that they scored near the top of “Average” and the low-involvement group scored in the middle of “High” (Figure 4.10).
Figure 4.10. Personality scores for the conscientiousness scale demonstrating significant differences between drivers with high and low involvement in inattention-related crashes and near-crashes.
The results of the NEO Five-Factor Inventory suggest that some differences exist between the high- and low-involvement drivers. The low-involvement drivers scored in the “high” or “very high” levels of extroversion, openness to experience, agreeableness, and conscientiousness. The high-involvement drivers scored either “High” or “Average” on all of these scales indicating more moderate tendencies in each of these areas of personality.
Performance-based test analyses
Waypoint. The WayPoint computer-based test provides a composite score on four driver characteristics, as follows:
- Channel capacity: Speed of information processing.
- Preventable near-crash/crash risk: Ranks a driver on a scale of 1 to 4 from significantly lower than average (odds ratio of 0.4) to greatly above average (odds ratio of 6.2 or higher).
- The expected number of moving violations in the next 5 years.
- Expected seat belt use.
Previous testing by NHTSA indicated that this test could identify high-risk drivers 62.2 percent of the time with a false alarm rate of 19.9 percent; however, these results were based on older drivers. T-tests were conducted to determine whether the high-involvement drivers scored significantly different on any of these four scales than did the low-involvement drivers. None of the t-tests showed significant differences between the high- and low-involvement drivers. This is an interesting result given that drivers’ self-reported moving violations were significantly different for these two groups. The descriptive statistics for each of these scales are presented in Tables 4.15 through 4.18.
Table 4.15. Descriptive statistics for the drivers with low and high involvement in inattention–related crashes and near-crashes for the Channel Capacity Score.
Statistic |
High Involvement |
Low Involvement |
|---|---|---|
N |
23 |
69 |
Mean |
5.48 |
5.31 |
Standard Deviation |
1.86 |
2.17 |
Table 4.16. Descriptive statistics for the drivers with low and high involvement in inattention–related crashes and near-crashes for the Preventable Crash Risk.
Statistic |
High Involvement |
Low Involvement |
|---|---|---|
N |
23 |
69 |
Mean |
0.30 |
1.55 |
Standard Deviation |
1.55 |
0.76 |
Table 4.17. Descriptive statistics for the drivers with low and high involvement in inattention–related crashes and near-crashes for the Expected Number of Moving Violations.
Statistic |
High Involvement |
Low Involvement |
|---|---|---|
N |
23 |
69 |
Mean |
1.30 |
1.31 |
Standard Deviation |
0.63 |
0.70 |
Table 4.18. Descriptive statistics for the drivers with low and high involvement in inattention–related crashes and near-crashes for the Expected Seatbelt Use.
Statistic |
High Involvement |
Low Involvement |
|---|---|---|
N |
23 |
67 |
Mean |
1.10 |
1.15 |
Standard Deviation |
029 |
0.36 |
Useful Field of View (UFOV). The Useful Field of View test is also a computer-based performance test that measures an individual’s central visual processing speed, divided attention, and selective attention. The participant is required to select rapidly presented target objects that are flashed on a computer monitor while simultaneously attending to other stimuli. Using this test, near-crash/crash risks are assigned to each individual.
T-tests were conducted for the composite UFOV score to determine whether significant differences in the high- versus low-involvement drivers existed in their central visual processing speed, divided attention, and selective attention abilities. No significant differences between the high- and low-involvement drivers were observed for the UFOV test. Descriptive statistics are presented in Table 4.19.
Table 4.19. Descriptive statistics for the drivers with low and high involvement in inattention–related crashes and near-crashes for the UFOV.
Statistic |
High Involvement |
Low Involvement |
|---|---|---|
N |
27 |
81 |
Mean |
1.78 |
2.32 |
Standard Deviation |
1.80 |
2.15 |
