CHAPTER 6: OBJECTIVE 5, WHAT IS THE RELATIVE NEAR-CRASH/CRASH RISK OF EYES OFF THE FORWARD ROADWAY? DO EYES OFF THE FORWARD ROADWAY SIGNIFICANTLY AFFECT SAFETY AND/OR DRIVING PERFORMANCE?
While eyeglance analyses have been used in transportation research for a variety of purposes and goals, this analysis is the first to establish a direct link between a driver's eyeglance behavior and crash and near-crash causation. Odds ratios were calculated to estimate the relative near-crash/crash risk of eyes off the forward roadway . Odds ratios were also calculated to estimate the relative risk for a crash or near-crash of different durations of eyes off the forward roadway as well. ANOVAs were conducted to determine if significant differences exist for several measures of eyeglance behavior. These measures include total time eyes off forward roadway , number of glances away from forward roadway , glance length , and length of longest glance away from the forward roadway.
Please note that there are some important and significant differences in the method used to conduct the analyses in this chapter and the method used in the previous chapters. First, in Chapters 3, 4, and 5, driving inattention was primarily defined as secondary task engagement or the presence of moderate to severe drowsiness. In Chapter 2, inattention also included driving-related inattention to the forward roadway and non-specific eyeglance . In this chapter, only eyeglance data will be considered. Therefore, any time a driver is not looking forward, regardless of the reason, is considered eyes off the forward roadway . Conducting the analysis in this manner completes the analysis of driver inattention in that Chapter 2, Objective 1 included all four types of inattention. Chapter 3, Objective 2 , Chapter 4, Objective 3 , and Chapter 5, Objective 4 all considered driver inattention primarily as secondary task engagement and drowsiness . Finally, this chapter will include any time the driver's eyes are off the forward roadway, which incorporates part of secondary task and drowsiness but will also encompass driving-related inattention to the forward roadway and non-specific eyeglance.
To first begin this analysis, an operational definition of eyes off forward roadway was determined. This metric is time dependent and a relevant time frame surrounding the crash or near-crash was also operationally defined. While some epidemiological studies have used time segments of 5 to 10 minutes prior to a crash (McEvoy et al, 2005; Riedelmeier and Tibshirani, 1997), the 100-Car Study examines within 5 seconds of the onset of the precipitating factor. Recall from the method section that the precipitating factor is the action that initiated the driving event (e.g., lead-vehicle braking) and circumstances that comprise the crash, near-crash, or incident. Therefore, all eyes off forward roadway calculations will be based upon a total time of 5 seconds prior and 1 second after the onset of the precipitating factor or onset of the conflict . Please note that this is not the instant the crash occurred. The data in which we are primarily interested is the pre-crash data or the seconds leading up to the crash. Therefore the onset of the conflict is used. Table 6.1 presents the metric calculations for the dependent variables that are used in the following analyses.
Table 6.1. Eyes off the forward roadway metrics.
|
Eyes Off Forward Roadway Metric |
Operational Definition |
|---|---|---|
1. |
Total Time Eyes Off Forward Roadway |
The number of seconds that the driver's eyes were off the forward roadway during the 5 seconds prior and 1 second after the onset of the precipitating factor. |
2. |
Number of Glances Away From the Forward Roadway |
The number of glances away from the forward roadway during the 5 seconds prior and 1 second after the precipitating factor. |
3. |
Length of Longest Glance Away from the Forward Roadway |
The length of the longest glance that was initiated during the 5 seconds prior and 1 second after the onset of the precipitating factor. |
4. |
Location of Longest Glance Away from the Forward Roadway |
The location of the longest glance (as defined by Length of Longest Glance). Location will be based upon distance (in degrees) from center forward and will be in one of three categories: less than 15°, greater than 15° but less than 30°, greater than 30°. |
Eyeglance analysis was conducted on all crashes, near-crashes, and incidents as well as 5,000 (as opposed to the entire set of 20,000) baseline epochs. Project resources restricted the number of baseline epochs for which eyeglance data reduction could be performed.
To determine the relative near-crash/crash risk of eyes off forward roadway, the data was parsed to exclude those events in which the driver of the instrumented vehicle was 1. not at fault and/or 2. was involved in a rear-end-struck crash or near-crash with a following vehicle. For the rear-end-struck crashes, eyeglance data was not available on the following driver, which prevented their inclusion in the analyses.
For the relative risk analyses in this chapter, crashes and near-crashes only will be used (incidents will be excluded from the analyses). In Chapter 6, Objective 2 of the 100-Car Study Final Report, the analyses indicated that the kinematic signatures of both crashes and near-crashes were nearly identical; whereas the kinematic signatures of incidents were more variable. Given this result and to increase statistical power, the data from both crashes and near-crashes will be used in the calculation of relative near-crash/crash risk and population attributable risk percentage.
QUESTION 1. WHAT IS THE RELATIVE NEAR-CRASH/CRASH RISK OF EYES OFF THE FORWARD ROADWAY?
To answer this question, the odds ratios associated with eyes off the forward roadway were calculated since odds ratios are appropriate approximations of relative near-crash/crash risk for rare events (Greenberg et al., 2001). The odds ratios were calculated for all instances of eyes off the forward roadway as well as for five ranges of time that the drivers’ eyes were off the forward roadway. These five time segments are as follows:
- Less than or equal to 0.5 seconds
- Greater than 0.5 seconds but less than or equal to 1.0 second
- Greater than 1.0 second but less than or equal to 1.5 seconds
- Greater than 1.5 seconds but less than or equal to 2.0 seconds
- Greater than 2.0 seconds
The odds ratios were calculated by using the following equation:
| Odds Ratio = (A x D)/(B x C) | Equation 6.1 |
Where:
A = the number of events where driver’s eyes were off the forward roadway <x total time>
B = the number of events where driver’s eyes were not off the forward roadway
C = the number of baseline epochs where driver’s eyes were off the forward roadway <x total time>
D = the number of baseline epochs where driver’s eyes were not off the forward roadway
Table 6.2 presents the odds ratios for the five segments of time as well as an overall odds ratio for eyes off the forward roadway. Note that the odds ratios for eyeglances equal to or less than 2 seconds were less than or not significantly different than 1.0. This may indicate that drivers who are scanning their environment are potentially safer drivers. However, eyeglances away from the forward roadway greater than 2 seconds, regardless of location of eyeglance, are clearly not safe glances as the relative near-crash/crash risk sharply increases to over two times the risk of normal, baseline driving. It is important to note that the confidence limits surrounding the point estimate odds ratio values are fairly large, indicating the odds ratio may in fact be somewhat higher or lower. However, the trend does appear to indicate that shorter glances are safer than longer eyeglances away from the forward roadway. The population attributable risk percentage calculations suggest that 23 percent of the crashes and near-crashes that occur in a metropolitan environment are attributable to eyes off the forward roadway greater than 2 seconds (Table 6.3).
Table 6.2. Odds ratios and 95 percent confidence intervals for eyes off the forward roadway.
|
Total Time of Eyes Off the Forward Roadway |
Odds Ratio |
Lower CL |
Upper CL |
|---|---|---|---|---|
1. |
Less than or equal to 0.5 seconds |
1.31 |
0.91 |
1.89 |
2. |
Greater than 0.5 seconds but less than or equal to 1.0 second |
0.82 |
0.60 |
1.13 |
3. |
Greater than 1.0 second but less than or equal to 1.5 s |
0.92 |
0.65 |
1.31 |
4. |
Greater than 1.5 seconds but less than or equal to 2.0 seconds |
1.26 |
0.89 |
1.79 |
5. |
Greater than 2.0 seconds |
2.19 |
1.72 |
2.78 |
6. |
OR for Eye Glance (all durations) |
1.32 |
1.09 |
1.60 |
Note: only the crashes and near-crashes where the subject driver is at fault are included in these data. Those numbers in bold font are significantly different from normal, baseline driving or 1.0.
Table 6.3. Population attributable risk percentage ratios and 95 percent confidence intervals for eyes off the forward roadway.
|
Total Time of Eyes Off the Forward Roadway |
Population Attributable Risk Percentage |
Lower CL |
Upper CL |
|---|---|---|---|---|
1. |
Less than or equal to 0.5 seconds |
4.27 |
3.66 |
4.88 |
2. |
Greater than 0.5 seconds but less than or equal to 1.0 second |
N/A |
N/A |
N/A |
3. |
Greater than 1.0 second but less than or equal to 2.0 s |
N/A |
N/A |
N/A |
4. |
Greater than 1.5 seconds but less than or equal to 2.0 seconds |
3.93 |
3.29 |
4.56 |
5. |
Greater than 2.0 seconds |
23.26 |
22.50 |
24.01 |
|
PAR% for Eye Glance (all durations) |
15.47 |
14.45 |
16.49 |
Note: only the crashes and near-crashes where the subject driver is at fault are included in these data. Those numbers in bold font are significantly different from normal, baseline driving or 1.0.
While the above results are indicative of any time that a driver’s eyes were averted from the forward roadway, regardless of the reason, near-crash/crash risk increases when the eyeglance is over 2 seconds. However eyeglances away from the forward roadway, specifically those to check rear-view mirrors, are important to safe driving. A driver who is glancing at one of the rear-view mirrors, for example, is exhibiting attentive and safe driving. Therefore, odds ratio calculations were also conducted to account for these behaviors. The following odds ratios were calculated for eyes off the forward roadway except when the driver was looking at the center, right, or left rear-view mirrors or checking traffic out the right or left windows. Please note that these glances were shown previously to possess a protective effect on driving safety (Chapter 2, Objective 1).
The resulting odds ratios (Table 6.4) demonstrate more effectively that as length of eyeglance from the forward roadway increases, the odds of being in a crash or near-crash also increases. Also note that the eyeglances away from the forward roadway greater than 2 seconds increase an individual’s relative near-crash/crash risk by two times that of normal, baseline driving. An overall odds ratio associated with eyeglance away from the forward roadway was also over 1.5 indicating that, eyes off the forward roadway greater than 2 seconds was a strong enough effect to boost the overall odds ratio significantly over 1.0.
The population attributable risk percentages, as shown in Table 6.5, indicated that over 18 percent of all at-fault crashes and near-crashes occurring in an urban environment are attributable to eyes off the forward roadway. Eighteen percent of these crashes and near-crashes were attributable to eyeglances away from the forward roadway greater than 2 seconds. This finding demonstrates that eyes off the forward roadway, especially eyeglances greater than 2 seconds, is a key issue in crash causation. Recall that this estimate does not include those crashes where the driver was not at fault and rear-end struck crashes since eyeglance data were not available. Therefore, it is possible that this estimate could be higher than is currently estimated.
Table 6.4. Odds ratios and 95 percent confidence intervals for eyes off forward roadway excluding eyeglances to center, right, and left rear-view mirrors.
|
Total Time of Eyes Off Forward Roadway |
Odds Ratio |
Lower CL |
Upper CL |
|---|---|---|---|---|
1. |
Less than or equal to 0.5 seconds |
1.13 |
0.67 |
1.92 |
2. |
Greater than 0.5 seconds but less than or equal to 1.0 second |
1.12 |
0.79 |
1.59 |
3. |
Greater than 1.0 second but less than or equal to 1.5 seconds |
1.14 |
0.79 |
1.65 |
4. |
Greater than 1.5 but less than or equal to 2.0 |
1.41 |
0.98 |
2.04 |
5. |
Greater than 2.0 seconds |
2.27 |
1.79 |
2.86 |
6. |
OR for Eye Glance Away From the Forward Roadway |
1.56 |
1.29 |
1.88 |
Note: only the crashes and near-crashes where the subject driver is at fault and the driver is not looking at a rear-view mirror are included in this table. Those numbers in bold font are significantly different from normal, baseline driving or 1.0.
Table 6.5. Population attributable risk percentage ratios and 95 percent confidence intervals for eyes off the forward roadway excluding eyeglances to center, right, and left rear-view mirrors.
|
Total Time of Eyes Off Forward Roadway |
Population Attributable Risk Percentage |
Lower CL |
Upper CL |
|---|---|---|---|---|
1. |
Less than or equal to 0.5 seconds |
0.74 |
0.41 |
1.06 |
2. |
Greater than 0.5 seconds but less than or equal to 1.0 second |
1.53 |
1.04 |
2.02 |
3. |
Greater than 1.0 second but less than or equal to 2.0 seconds |
1.56 |
1.10 |
2.03 |
4. |
Greater than 1.5 seconds but less than or equal to 2.0 seconds |
3.81 |
3.35 |
4.26 |
5. |
Greater than 2.0 seconds |
18.88 |
18.27 |
19.49 |
6. |
PAR% for Eye Glance |
18.25 |
17.49 |
19.01 |
Note: only the crashes and near-crashes where the subject driver is at fault and the driver is not looking at a rear-view mirror are included in this table. Those numbers in bold font are significantly different from normal, baseline driving or 1.0.
QUESTION 2. DO EYES OFF THE FORWARD ROADWAY SIGNIFICANTLY AFFECT SAFETY AND/OR DRIVING PERFORMANCE?
To answer this research question, four metrics of eyes off the forward roadway were calculated and ANOVAs were conducted to determine if significant differences exist between the crashes, near-crashes, and incidents plus baseline driving epochs. The first ANOVA was conducted using total time eyes off forward roadway . The ANOVA indicated significant differences among the four levels of severity as shown in Figure 6.1 (F(3, 11,174) = 33.36, p < 0.0001). Tukey post-hoc t-tests indicate that significant differences were present between all pairs as shown in Table 6.6. These results indicate that drivers involved in crashes had their eyes off the forward roadway a significantly longer portion of the 6 seconds prior to the conflict than did those drivers involved in near-crashes or incidents. Interestingly, drivers' eyes were off the roadway a significantly smaller portion of the 6-second segment than those drivers involved in safety-relevant conflicts.
Figure 6.1. The total mean time drivers’ eyes were off the forward roadway during the 6-second segment of time prior to the onset of the conflict.
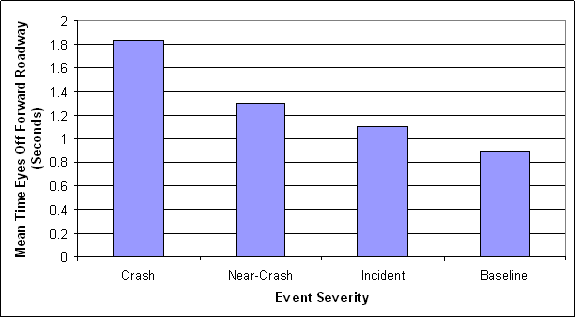
Table 6.6. T-test results for total time eyes off the forward roadway.
|
Severity |
dF |
t-value |
p-value |
|---|---|---|---|---|
1. |
Crash and Near-crash |
11,174 |
2.74 |
0.03 |
2. |
Crash and Incident |
11,174 |
3.79 |
0.009 |
3. |
Crash and Baseline |
11,174 |
4.87 |
< 0.0001 |
4. |
Near-crash and Incident |
11,174 |
2.57 |
0.05 |
5. |
Near-crash and Baseline |
11,174 |
5.60 |
<0.0001 |
6. |
Baseline and Incident |
11,174 |
8.10 |
<0.0001 |
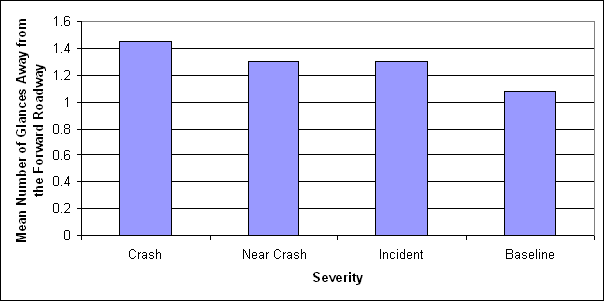
The second metric involved the number of glances away from the forward roadway that occurred during the 5 seconds prior and 1 second after the onset of the conflict. Figure 6.2 shows the mean number of glances made by drivers just prior to involvement in crashes, near-crashes, incidents, and baseline events. An ANOVA indicated statistical significance among these four levels of event severity, F(3, 11,174) = 22.02, p < 0.0001. Post hoc Tukey t-tests were conducted on all pair combinations which indicated that near-crashes were significantly different from the baseline epochs, (t(11,174) = 2.83 p < 0.05) and incidents were significantly different from baseline epochs (t(11,174) = 7.93, p < 0.0001).
Figure 6.2. Mean number of glances away from the forward roadway occurring during 5 seconds prior and 1 second after the onset of the conflict or during a 6-second baseline driving epoch.
The mean length of longest glance away from the forward roadway is the only metric not confined to the 5 seconds prior and 1 second after the onset of the conflict. Rather, the longest glance away simply has to be initiated within the 5 seconds prior and 1 second after but may extend into the actual conflict. This metric was calculated since there were many crashes that occurred in which the driver was looking away from the forward roadway up to the moment of the crash. This eyeglance behavior would be missed if restricted to the 6-second period of time surrounding the onset of the conflict.
Figure 6.3 shows the results of the ANOVA which indicates that drivers’ mean length of longest glance was over 0.5 seconds longer for crashes than for near-crashes (F (3, 11,177) = 34.94, p < 0.0001). Post hoc Tukey t-tests indicated that all four groups were significantly different from each other. The results from the post hoc Tukey t-tests are shown in Table 6.7. Note that these results are similar to those found by Dingus, Antin, Hulse and Wierwille, (1989) that stated that drivers do not tend to look away from the forward roadway greater than 1 or 1.5 seconds for any given glance. Figure 6.3 supports this earlier result in that the mean length of any one glance was between 1.6 and 0.7 seconds.
Figure 6.3. Mean length of longest glance initiated during the 5 seconds prior and 1 second after the onset of the conflict.
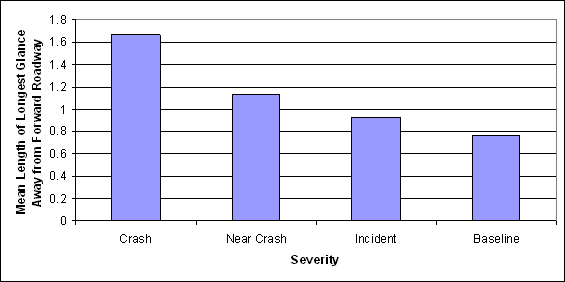
Table 6.7. Results from the Tukey post hoc T-Tests.
|
Severity |
dF |
t-value |
p-value |
|---|---|---|---|---|
1. |
Crash and Near-crash |
11,177 |
3.16 |
0.0087 |
2. |
Crash and Incident |
11,177 |
4.52 |
<0.0001 |
3. |
Crash and Baseline |
11,177 |
5.53 |
< 0.0001 |
4. |
Near-crash and Incident |
11,177 |
3.38 |
0.0040 |
5. |
Near-crash and Baseline |
11,177 |
6.22 |
<0.0001 |
6. |
Baseline and Incident |
11,177 |
7.60 |
<0.0001 |
The eyeglance location analysis was an analysis of the location of the longest glance away from the forward roadway that was initiated during the 5 seconds prior and 1 second after the onset of the conflict. Eyeglance data reduction was conducted using the following locations of eyeglance:
- Left window
- Left mirror
- Left Forward
- Center Forward
- Center Mirror
- Right Forward
- Right mirror
- Right Window
- Instrument Panel
- Radio/HVAC
- Passenger in right-hand seat
- Hand-held device
- Object/Other
- Eyes closed
These locations were split into three general locations based upon degrees of visual angle away from center forward (illustrated in Figure 6.4). The first group, called Ellipse 1, included all locations that were 20° or less away from center forward. Ellipse 2 included all locations that were up to 40° but greater than 20°. The last Ellipse includes all locations greater than 40° as well as hand-held device, object, and eyes closed. The eyeglance categories that were assigned to each ellipse are as follows:
Ellipse 1: Left Forward, Right Forward, and Instrument Panel
Ellipse 2: Center Mirror, Radio/HVAC, and Left Mirror
Ellipse 3: Left Window, Right Mirror, Right Window, Passenger in Right-Hand Seat, Hand-Held Device, Object/Other, and Eyes Closed.
While there is some overlap in these ellipse selections, the eyeglance location was placed in the ellipse closer to the central field of view than further away.
Figure 6.4. Depiction of degrees of visual angle from center forward that objects in the cockpit of an automobile are generally located.
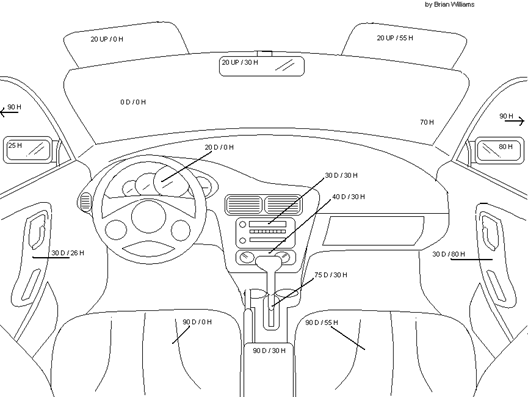
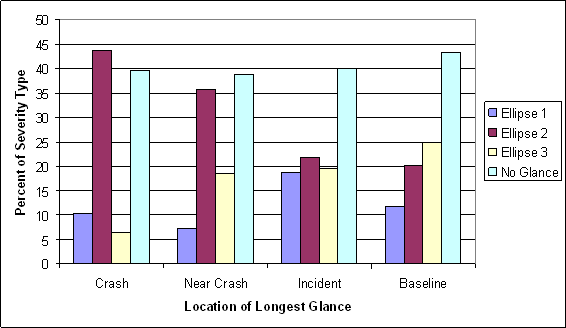
Figure 6.5 presents the percent of crashes, near-crashes, incidents, and baseline epochs in which the longest glance away from the forward roadway was within each ellipse. A chi-square analysis was conducted to determine if there were significant differences in the frequency of events or epochs at these locations, and the results indicated that there are significant differences (X (9) = 208.42, p > 0.0001). Note that for incidents, the driver’s longest glances away from the forward roadway are spread fairly evenly across all three ellipse locations, however for crashes and near-crashes, drivers’ longest glances were most frequently between 20° and 40° away from center forward. Baseline epochs had the most glances in Ellipse 3; however it is unknown whether the differences among the three ellipse locations for baseline epochs are significantly different. These results may indicate that many crashes and near-crashes could potentially be avoided if the driver’s gaze could be re-directed when gaze direction resides between 20 and 40° away from center forward.
Figure 6.5. The percentage of the location of the longest glance away from the forward roadway by severity.
The use of eyeglance behavior in driving research is a complicated construct. W hy the driver was looking away from the forward roadway can not be ignored from the analysis if one is interested in driving inattention. In driving research it is commonly written that a driver looking away from the forward roadway is an inattentive driver . It is also commonly written that a driver who is systematically scanning his/her environment (i.e., looking away from the forward roadway) is an attentive driver .
The total time eyes are away from the forward roadway may or may not be a source of potential inattention, depending upon the purpose for looking away. The results, using the metric total time eyes are away from the forward roadway , indicate that viewing the rear-view mirror or windows to check traffic were safe actions that resulted in a relative near-crash/crash risk of less than 1.0. When the total time eyes were off the forward roadway was greater than 2seconds, regardless of where the driver was looking, an increased risk of crash or near-crash involvement (OR = 2.3) was observed.Statistically significant differences were identified using the four eyeglance behavior metrics for crashes, near-crashes, incidents, and baseline epochs. These results indicated that the longer eyeglances and longer periods of time that the drivers’ eyes were away from the forward roadway significantly impacted driving performance. Drivers who were involved in crashes had an average total time eyes away from the forward roadway of nearly 2 seconds with 1.5 seconds mean length of longest glances. Drivers involved in near-crashes had an average total time away from the forward roadway closer to 1 second and the same for mean longest glance length. While statistically significant differences were observed for number of glances, caution may be required as the practical differences between 1.4 glances and 1.2 glances away from the forward roadway.
Interesting results were also obtained when analyzing the location of the longest glance away from the forward roadway. Note that for crashes and near-crashes, drivers were more far more frequently looking in Ellipse 2 than other locations. The frequency of longest-glance location for incidents and baseline epochs appeared to be somewhat more evenly spread across the three ellipses. One issue with this analysis was that if the driver was looking at a hand-held device or at another object, the distance away from center forward is unknown and may not be located within Ellipse 3. It was decided to put these two categories in Ellipse 3 as it appeared that drivers usually were looking at objects in their lap or the seat next to them, and dialed their hand-held device near their lap. It is doubtful that this discrepancy in the operational definition had a very large impact as the frequencies for the category was fairly low for the crashes and near-crashes, especially.
These results demonstrate that eyeglances away from the forward roadway, especially those that do not involve checking rear-view mirrors, may be contributing factors to a high percentage of crashes. Please note that for 40 percent of the crashes, near-crashes, and incidents, the driver did not look away from the forward roadway for the 5 seconds prior and 1 second after the onset of the conflict. This result leaves 60 percent, a majority of the crashes, near-crashes, and incidents, where glances away from the forward roadway were a contributing factor. This result has implications for collision-avoidance-warning designers in that if they could incorporate where the driver is looking in their warning algorithms, their systems could be vastly improved by reducing false alarms and also reducing crash involvement and/or injuries.