EXECUTIVE SUMMARY
The purpose of this report was to conduct in-depth analyses of driver inattention using the driving data collected in the 100-Car Naturalistic Driving Study. These data provide unique opportunities for transportation researchers as data were collected over an 18-month period and represent normal, daily driving with all the stress and pressures that occur in a metropolitan environment.
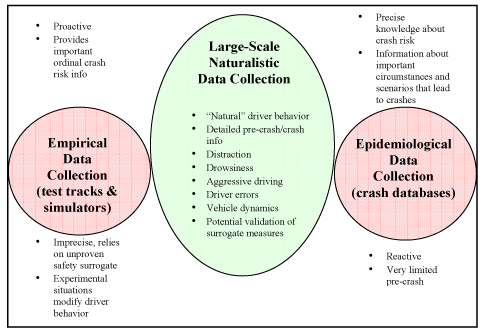
This analysis also demonstrates one of the primary strengths of large-scale naturalistic driving data in that analytical methods from epidemiology, empirical research, and qualitative research can all be employed to answer research questions. Figure ES.1 shows the relationship of naturalistic data to empirical and epidemiological data. Naturalistic data can help complete gaps in the transportation research between epidemiology and empirical methods by collecting enough data to conduct epidemiological analyses while still collecting detailed driver behavior and driving performance data.
Figure ES.1. The relationship between empirical, naturalistic, and epidemiological methods in driving safety research.
The following analyses are able to establish direct relationships between driving inattention and crash and near-crash involvement because of the extensive real-world observations of drivers’ behavior. Relative near-crash/crash risk was calculated (odds ratios) using both crash and near-crash data compared to normal, baseline driving data for various sources of inattention. Crashes and near-crashes were used because it was found that the kinematic signatures of both are similar and using both increased statistical power. The corresponding population attributable risk percentage calculations were used to determine what percentage of crashes and near-crashes occurring in the population are attributable to inattention. The relative near-crash/crash risk and population attributable risk percentage calculations provide useful counterpoint assessments of the crash-risk problem. The odds ratio provides the increased risk of each source of inattention per individual whereas the population attributable risk percentage provides an assessment of how this individual risk translates to a percentage of crashes and near-crashes in the population at-large.
For these analyses, two reduced databases were used: the 100-Car Study event database that consists of the reduced crashes, near-crashes, and incidents; and the baseline database. The baseline database was created specifically for this analysis by stratifying the entire dataset based upon the number of crashes, near-crashes, and incidents each vehicle was involved in and then randomly selecting 20,000 6-second segments from the 6.3 terabytes of driving data. For example, a vehicle involved in over 3 percent of all the total crashes, near-crashes, and incidents would also represent 3 percent of the baselines. Vehicles that were not involved in any crashes, near-crashes, or incidents were not represented in the baseline database. This stratification of the baseline epochs was performed to create a case-control data set where there are multiple baseline epochs per each crash or near-crash event to allow for more accurate calculation of odds ratios.
The variables that were recorded for the 20,000 baseline epochs included the vehicle, environmental, and most drivers’ state variables. In addition, eyeglance analyses were performed for 5,000 of these baseline epochs. The event variables were not recorded for the baseline epochs as these variables (e.g., precipitating factor, evasive maneuver) were not present when an incident, near-crash, or crash did not occur. Table ES.1 shows the breakdown of the type of data that currently exists as part of the original 100-Car Study event database and the baseline database.
Table ES.1. Description of the Databases Created for the Distraction Analysis
|
100-Car Study Event Database |
Baseline Database (epochs) |
|---|---|---|
1. |
Vehicle variables |
Vehicle variables |
2. |
Event variables |
N/A |
3. |
Environmental Variables |
Environmental Variables |
4. |
Driver's State Variables |
Driver's State Variables |
Eyeglance data (crashes, near-crashes, and incidents) |
Eyeglance data on 5,000 randomly selected baseline distraction events. |
|
|
Observer Rating of Drowsiness (ORD) for crashes and near-crashes |
Drowsiness was marked yes/no with yes = ORD of 60 or above. |
5. |
Driver/Vehicle 2 |
N/A |
10. |
Narrative |
N/A |
The questionnaire data collected during the 100-Car Study was also used in these analyses. Table ES.2 presents a list of all the surveys and test batteries that were administered to the primary drivers.
Table ES.2. Description of questionnaire and computer-based tests used for the 100-Car Study.
|
Name of Testing Procedure |
Type of Test |
Time test was administered |
Brief description |
|---|---|---|---|---|
1. |
Driver demographic information |
Paper/pencil |
In-processing |
General information on driver age, gender, etc. |
2. |
Driving History |
Paper/pencil |
In-processing |
General information on recent traffic violations and recent collisions. |
3. |
Health assessment questionnaire |
Paper/pencil |
In-processing |
List of variety of illnesses/medical conditions/or any prescriptions that may affect driving performance. |
4. |
Dula Dangerous Driving Index |
Paper/pencil |
In-processing |
One score that describes driver's tendencies toward aggressive driving. |
5. |
Sleep Hygiene |
Paper/pencil |
In-processing |
List of questions that provide information about driver's general sleep habits/substance use/sleep disorders. |
6. |
Driver Stress Inventory |
Paper/Pencil |
In-processing |
One score that describes the perceived stress levels drivers experience during their daily commutes. |
7. |
Life Stress Inventory |
Paper/pencil |
In-processing/Out-processing |
One score that describes drivers stress levels based upon the occurrence of major life events. |
8. |
Useful Field-of-View |
Computer-based test |
In-processing |
Assessment of driver's central vision and processing speed, divided and selective attention. |
9. |
Waypoint |
Computer-based test |
In-processing |
Assessment of the speed of information processing and vigilance. |
10. |
NEO-FFI |
Paper/pencil |
In-processing |
Personality test. |
11. |
General debrief questionnaire |
Paper/pencil |
Out-processing |
List of questions ranging from seatbelt use, driving under the influence, and administration of experiment. |
The analyses reported in this document are derived from direct measurements of driver inattention immediately prior to a crash or near-crash. The analytical methods that were used in this report were borrowed from epidemiology, empirical research, and qualitative research. The application of these analytical methods demonstrates the power of naturalistic driving data and its importance in relating driving behavior to crash and near-crash involvement.
Driver inattention was defined for this report as one of the following:
- Driver engagement in secondary tasks (those tasks not necessary to the primary task of driving)
- Driver drowsiness
- Driving-related inattention to the forward roadway
- Non-specific eyeglance away from the forward roadway
These four types of inattention, singly or in combination, were used to answer the research questions addressed in this report. Some of the important findings are presented below:
- This study allowed for the calculation of relative near-crash/crash risk of engaging in various types of inattention-related activities. Some of the primary results were that driving while drowsy increases an individual’s near-crash/crash risk by four to six times, engaging in complex secondary tasks increases risk by three times, and engaging in moderate secondary tasks increases risk by two times that of normal, baseline driving. Driving-related inattention to the forward roadway was actually shown to be safer than normal, baseline driving (odds ratio of 0.45). This was not surprising as drivers who are checking their rear-view mirrors are generally alert and engaging in environmental scanning behavior.
- This study also allowed for the calculation of population attributable risk percentages. This calculation produces an estimate of the percentage of crashes and near-crashes in the population where the specific inattention-related activity was a contributing factor. The results of this analysis indicated that driving while drowsy was a contributing factor for 22 to 24 percent of the crashes and near-crashes and secondary-task distraction contributed to over 22 percent of all crashes and near-crashes. This is a useful metric since odds ratios estimate risk on a per-task (or drowsiness episode) basis while the population attributable risk percentage accounts for the frequency of occurrence. Thus, some inattention-related activities that indicated high relative near-crash/crash risk had corresponding population attributable risk percentages indicating low total percentages. This was due to lower frequency of occurrence. Conversely, other more frequently performed inattention activities, while obtaining lower relative near-crash/crash risks, obtained higher population attributable risk percentages.
- The prevalence of driving inattention was analyzed by using normal, baseline driving (i.e., no event crash, near-crash, or incident present) as established by the baseline distraction database. The four types of inattention were recorded alone and in combination with the other types of inattention. The percent of the total baseline epochs in which drivers were engaged in each type of inattention is as follows:
Note that the total is higher than 100 percent since drivers engaged in multiple types of inattention activities at one time. Non-specific eyeglance was most frequently recorded as associated with the other types of inattention but accounts for only 2 percent of the baseline epochs, singularly. Given that the baseline epochs most closely represent “normal, baseline driving,” these results suggest that drivers frequently engage in inattention-related tasks.secondary tasks – 54 percent of baseline epochs
driving-related inattention – 44 percent of baseline epochs
drowsiness – 4 percent of baseline epochs
non-specific eyeglance – 2 percent of baseline epochs
- The analysis of eyeglance behavior indicates that total eyes-off-road durations of greater than 2 seconds significantly increased individual near-crash/crash risk whereas eyeglance durations less than 2 seconds did not significantly increase risk relative to normal, baseline driving. The purpose behind an eyeglance away from the roadway is important to consider. An eyeglance directed at a rear-view mirror is a safety-enhancing activity in the larger context of driving while eyeglances at objects inside the vehicle are not safety-enhancing. It is important to remember that scanning the driving environment is an activity that enhances safety as long as it is systematic and the drivers’ eyes return to the forward view in under 2 seconds.
- The results for the analysis investigating the impact of driver drowsiness on environmental conditions resulted in many interesting results. First, driver drowsiness may vary depending on time of day or ambient lighting conditions. Drowsiness was also seen to slightly increase in the absence of high roadway or traffic demand. A higher percentage of drowsiness-related baseline epochs were found during free-flow traffic densities on divided roadways and areas free of roadway junctions.
- The results of the analysis investigating the impact of complex or moderate secondary task engagement on various environmental conditions were more varied. Each of the eight environmental conditions resulted in odds ratios greater than 1.0 when engaging in complex secondary tasks. Engaging in moderate secondary tasks rarely resulted in odds ratios significantly greater than 1.0 which indicates that these behaviors are not as risky as driving while engaging in complex secondary tasks.
- The most frequent type of secondary task engagement, hand-held device use, also obtained odds ratios greater than 1.0 for both dialing hand-held device (OR = 2.8; CL = 1.6 – 4.9) and talking/listening to a hand-held device (OR = 1.3; CL = 0.9 – 1.8). Talking/listening to a hand-held device was not significantly different than 1.0, indicating that this task was not as risky as dialing a hand-held device. Despite the differences in these odds ratios, the hand-held-device-related secondary tasks had nearly identical population attributable risk percentages (each contributing to 3.6 percent of crashes and near-crashes). This is because drivers were talking/listening to hand-held devices a much larger percentage of time than they were dialing hand-held devices. Thus, the percentage of crashes and near-crashes that were attributable to these two actions was similar due to the fact that dialing was more dangerous but was performed less frequently whereas talking/listening was less dangerous but performed more frequently.
- The results from the survey and test battery response analyses indicated that drivers with high involvement in inattention-related crashes and near-crashes were significantly younger and possessed less driving experience than the drivers who were involved in fewer inattention-related crashes and near-crashes. The high-involvement drivers also self-reported significantly more traffic violations and being involved in more accidents prior to the beginning of the study. Other test scores demonstrated that the high-involvement drivers were more often drowsy and scored significantly lower on selected personality inventories than did the drivers that were involved in fewer inattention-related crashes and near-crashes.
- A clear relationship between involvement in inattention-related crashes and near-crashes and engaging in inattention-related activities during baseline driving was observed. A correlation of 0.72 was obtained suggesting that those drivers who are frequently involved in inattention-related crashes and near-crashes are not simply getting “caught” at inopportune moments. These drivers engage in inattention-related activities frequently. Those drivers who are not frequently engaging in inattention-related tasks are therefore not involved in as many inattention-related crashes and near-crashes.