CHAPTER 1: INTRODUCTION AND METHOD
Transportation researchers have long been aware of the negative effects of driver distraction and inattention on driving performance. Researchers have devised clever experimental designs on test tracks and simulators to gain greater understanding of the effects of various sources of driver inattention on reaction time, lateral deviations, time-to-collision (TTC), etc., in both normal and unexpected driving environments. While this research is important and useful to understanding whether these behaviors impact driving performance, it is largely unknown whether driver inattention actually decreases safety and relative crash risk on roadways (Hancock, Lesch, and Simmons, 2003; Dingus, 1995).
Crash database research has found that driver inattention is a contributing factor in approximately 25 to 30 percent of all actual crashes on roadways (Wang, Knipling, and Goodman, 1996). Unfortunately, this statistic is based upon police accident reports that were completed at the scene of crashes. The investigating police officer would only mark distraction or inattention if the driver admitted guilt or an eyewitness observed that the driver was inattentive. Given the source of this information and the potential for inaccurate information to be recorded, most transportation researchers believe that the actual percentage is much higher. Regardless of beliefs, the true effects of driving inattention on crash rates are unknown.
While both empirical and epidemiological research are useful to understanding aspects of the problem of driving inattention, there are significant questions that still need to be addressed. The 100-Car Naturalistic Driving Study (Dingus et al., 2005) provides the type of pre-crash driver behavior data that is necessary to take initial steps at calculating measures such as:
- The increased relative near-crash/crash risk for various types of driver inattention
- The frequency and prevalence of driver inattention in a normal roadway environment
- The types of environmental conditions in which drivers choose to engage in driving inattention
- The impact of eyeglance behavior on near-crash/crash risk
Also, using questionnaire data from the participating drivers, initial attempts to characterize those drivers who are involved in inattention-related crashes versus those drivers who are not involved in inattention-related crashes can also be performed.
The purpose of this report was to conduct in-depth analyses of driver inattention using the driving data collected in the 100-Car Study. These data provide unique opportunities for transportation researchers, as data were collected in 109 cars for a period of 12 to 13 months per car. The data represent normal, baseline driving with all the natural stress and pressures that occur in an urban environment.
For the analyses conducted in this report, two reduced databases were used: the 100-Car Study event database and the baseline database.
For the original 100-Car Study analyses, the event database consisted of crashes, near-crashes, and incidents, which were defined as follows:
- Crash: Any physical contact between the subject vehicle and another vehicle, fixed object, pedestrian, cyclist, animal, etc., as assessed by either the lateral or longitudinal accelerometers.
- Near-crash: A conflict situation requiring a rapid, severe, evasive maneuver to avoid a crash.
- Incident: A conflict requiring an evasive maneuver, but of lesser magnitude than a near-crash.
The baseline database was created specifically for this analysis by randomly selecting a stratified sample of 20,000 6-second segments, referred to as baseline epochs. The method used to randomly stratify this sample will be discussed in detail below.
This report will use the event database, the baseline database, and the questionnaire data to answer the following six research objectives:
Objective 1. What are the prevalence as well as the types of driver inattention in which drivers engage during their daily driving? What is the relative risk of a crash or near-crash while engaging in an inattentive task? Does the relative risk differ for different types of secondary tasks?
Objective 2. What are the environmental conditions associated with a drivers’ choice of engaging in secondary tasks or driving while drowsy? What are the relative risks of a crash or near-crash while engaging in driving inattention while encountering these environmental conditions (e.g., time of day, road type, weather conditions, passengers in the vehicle, etc.)?
Objective 3. Determine the differences in demographic data, test battery results, and performance-based measures between inattentive and attentive drivers? How might that knowledge be used to mitigate the potential negative consequences of inattentive driving behaviors? Could this information be used to improve driver education courses or traffic schools?
Objective 4. What is the relationship between measures obtained from pretest batteries (e.g., a life stress test) and the frequency of engagement in distracting behaviors while driving? Does there appear to be any correlation between willingness to engage in distracting behaviors and life stress scores, personality characteristics, or ability to focus attention?
Objective 5. Are there differences in driving performance for drivers who are engaging in an inattentive task versus those drivers who are attending solely to the forward roadway?
Objective 6. Are there differences in driving performance for drivers who are engaging in a distraction task versus those drivers who are attending to driving? Are some of the safety surrogate measures more sensitive to driving performance differences when driving while distracted versus other safety surrogate measures?
Each of these six research objectives will be presented in a separate chapter with results from the data analysis and conclusions. The last chapter of the report will summarize all key results and conclusions from this analysis and outline future directions for this research.
For a complete description of the 100-Car Study method, instrumentation, and data collection procedure, refer to Dingus et al. (2005). In order to provide an abbreviated description, the following description is provided from the Neale, Klauer, Dingus, and Goodman (2005) report.
The 100-Car Study instrumentation package was engineered by the Virginia Tech Transportation Institute (VTTI) to be rugged, durable, expandable, and unobtrusive. It constituted the seventh generation of hardware and software developed over a 15-year period that has been deployed for a variety of purposes. The system consisted of a Pentium-based computer that receives and stores data from a network of sensors distributed around the vehicle. Data storage was achieved via the system’s hard drive, which was large enough to store data for several weeks of driving before requiring data downloading.
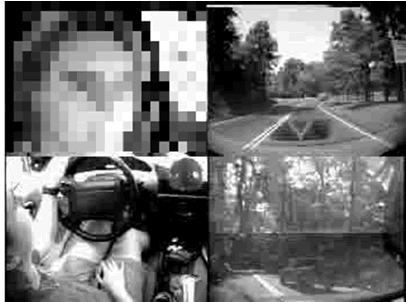
Each of the sensing subsystems in the car was independent so any failures that occurred were constrained to a single sensor type. Sensors included: a vehicle network box that interacted with the vehicle network, an accelerometer box that obtained longitudinal and lateral kinematic information, a headway detection system to provide information on leading or following vehicles, side obstacle detection to detect lateral conflicts, an incident box to allow drivers to flag incidents for the research team, a video-based lane-tracking system to measure lane-keeping behavior, and video to validate any sensor-based findings. The video subsystem was particularly important as it provided a continuous window into the happenings in and around the vehicle. This subsystem included five camera views monitoring the driver’s face and driver side of the vehicle, the forward view, the rear view, the passenger side of the vehicle, and an over-the-shoulder view for the driver’s hands and surrounding areas. An important feature of the video system is that it was digital with software-controllable video compression capability. This allowed synchronization, simultaneous display, and efficient archiving and retrieval of 100-Car Study data. A frame of compressed 100-Car Study video data is shown in Figure 1.1.
The modular aspect of the data collection system allowed for integration of instrumentation that was not essential for data collection, but provided the research team with additional and important information. These subsystems included: automatic collision notification that informed the research team of the possibility of a collision; cellular communications that were used by the research team to communicate with vehicles on the road to determine system status and position; system initialization equipment that automatically controlled system status; and a Global Positioning System (GPS) subsystem that collected information on vehicle position. The GPS subsystem and the cellular communications were often used in concert to allow for vehicle localization and tracking.
Figure 1.1. A compressed video image from the 100-Car Study data. The driver’s face (upper left quadrant) is distorted to protect the driver’s identity. The lower right quadrant is split with the left-side (top) and the rear (bottom) views.
The system included several major components and subsystems that were installed on each vehicle. These included the main data acquisition system (DAS) unit that was mounted under the package shelf for the sedans (Figure 1.2) and behind the rear seat in the SUVs.
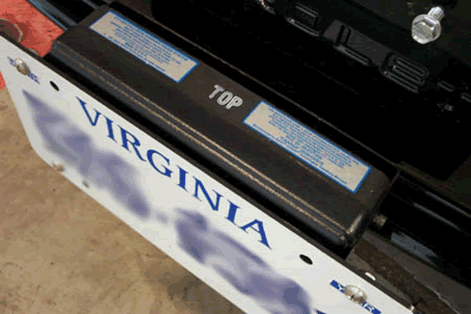
Doppler radar antennas were mounted behind special plastic license plates on the front and rear of the vehicle (Figure 1.3). The location behind the plates allowed the vehicle instrumentation to remain inconspicuous to other drivers.
Figure 1.2. The main DAS unit mounted under the “package shelf” of the trunk.
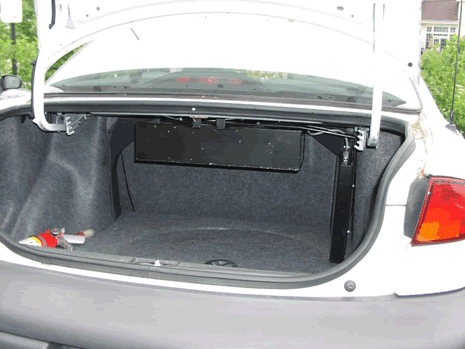
Figure 1.3. Doppler radar antenna mounted on the front of a vehicle, covered by a mock-up of one of the plastic license plates used for the study.
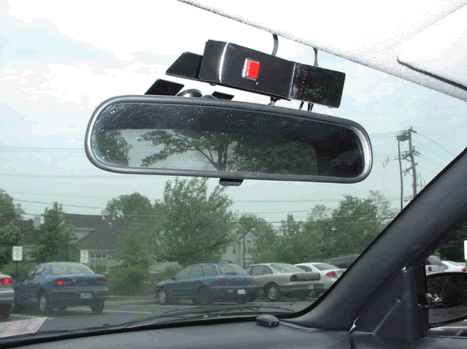
The final major components in the 100-Car Study hardware installation were mounted above and in front of the center rear-view mirror. These components included an “incident” pushbutton box which housed a momentary pushbutton that the subject could press whenever an unusual event happened in the driving environment. Pressing the incident button would open an audio channel which recorded the driver’s voice explaining the nature of the incident. Also contained in the housing was an unobtrusive miniature camera that provided the driver face view. The camera was invisible to the driver since it was mounted behind a “smoked” Plexiglas cover.
Mounted behind the center mirror were the forward-view camera and the glare sensor (Figure 1.4). This location was selected to be as unobtrusive as possible and did not occlude the driver’s normal field of view.
Figure 1.4. The incident pushbutton box mounted above the rear-view mirror. The portion on the right contains the driver-face/left-vehicle side camera hidden by a smoked plexiglass cover.
One-hundred drivers who commuted into or out of the Northern Virginia/Washington, DC, metropolitan area were initially recruited as primary drivers to have their vehicles instrumented or to receive a leased vehicle for this study. Drivers were recruited by placing flyers on vehicles as well as by placing announcements in the classified section of local newspapers. Drivers who had their private vehicles instrumented (78) received $125 per month and a bonus at the end of the study for completing necessary paperwork. Drivers who received a leased vehicle (22) received free use of the vehicle, including standard maintenance, and the same bonus at the end of the study for completing necessary paperwork. Drivers of leased vehicles were insured under the Commonwealth of Virginia policy.
As some drivers had to be replaced for various reasons (for example, a move from the study area or repeated crashes in leased vehicles), 109 primary drivers were included in the study. Since other family members and friends would occasionally drive the instrumented vehicles, data were collected on 132 additional drivers.
A goal of this study was to maximize the potential to record crash and near-crash events through the selection of subjects with higher than average crash or near-crash risk exposure. Exposure was manipulated through the selection of a larger sample of drivers below the age of 25, and by the selection of a sample of drivers who drove more than the average number of miles. The age by gender distribution of the primary drivers is shown in Table 1.1. The distribution of miles driven by the subjects during the study appears as Table 1.2. As presented, the data are somewhat biased compared to the national averages in each case, based on TransStats, 2001. Nevertheless, the distribution was generally representative of national averages when viewed across the distribution of mileages within the TransStats data.
One demographic issue with the 100-Car Study data sample that needs to be understood is that the data were collected in only one region (i.e., Northern Virginia/Washington, DC, metropolitan area). This area represents primarily urban and suburban driving conditions, often in moderate to heavy traffic. Thus, rural driving, as well as differing demographics within the United States, are not well represented.
Table 1.1. Driver age and gender distributions.
|
Gender |
|
|
|---|---|---|---|
Age |
Female |
Male |
Grand Total |
18-20 |
9 |
7 |
16 |
|
8.3% |
6.4% |
14.7% |
21-24 |
11 |
10 |
21 |
|
10.1% |
9.2% |
19.3% |
25-34 |
7 |
12 |
19 |
|
6.4% |
11.0% |
17.4% |
35-44 |
4 |
16 |
20 |
|
3.7% |
14.7% |
18.3% |
45-54 |
7 |
13 |
20 |
|
6.4% |
11.9% |
18.3% |
55+ |
5 |
8 |
13 |
|
4.6% |
7.3% |
11.9% |
Total N |
43 |
66 |
109 |
Total % |
39.4% |
60.6% |
100.0% |
Table 1.2. Actual miles driven during the study.
Actual miles driven |
Number of Drivers |
Percent of Drivers |
|---|---|---|
0-9,000 |
29 |
26.6% |
9,001-12,000 |
22 |
20.2% |
12,001-15,000 |
26 |
23.9% |
15,001-18,000 |
11 |
10.1% |
18,001-21,000 |
8 |
7.3% |
More than 21,000 |
13 |
11.9% |
A goal of the recruitment process was to attempt to avoid extreme drivers in either direction (i.e., very safe or very unsafe). Self-reported historical data indicate that a reasonably diverse distribution of drivers was obtained.
Since over 100 vehicles had to be instrumented with a number of sensors and data collection hardware and the complexity of the hardware required a number of custom mounting brackets to be manufactured, the number of vehicle types had to be limited for this study. Six vehicle models were selected based upon their prevalence in the Northern Virginia area. These included five sedan models (Chevrolet Malibu and Cavalier, Toyota Camry and Corolla, and Ford Taurus) and one SUV model (Ford Explorer). The model years were limited to those with common body types and accessible vehicle networks (generally 1995 to 2003). The distribution of these vehicle types was:
- Toyota Camry – 17 percent
- Toyota Corolla – 18 percent
- Chevy Cavalier – 17 percent
- Chevy Malibu – 21 percent
- Ford Taurus – 12 percent
- Ford Explorer – 15 percent
PROCEDURE FOR DATA REDUCTION: 100-CAR STUDY EVENT DATABASE
Data reduction for the 100-Car Naturalistic Driving Study as well as for these current analyses refers to a process of recording specific variables based upon review of the video. This data reduction process will be discussed in detail in the following sections.
As stated in Dingus et al. (2005), data were collected continuously on board the instrumented vehicles. As project resources did not allow for the review of all the data, a sensitivity analysis was conducted to establish post-hoc “triggers.” A post-hoc trigger uses either a single signature (e.g., any lateral acceleration value greater than ±0.6 g) or multiple signatures (e.g., forward TTC value > 3 seconds plus a longitudinal deceleration value > -0.5 g) in the driving performance data stream to identify those points in time when it was likely that a driver was involved in an incident, near-crash, or crash.
Figure 1.5 shows the data reduction plan in a flow chart format. Raw data from each vehicle was saved on the network attached storage (NAS) unit at VTTI until approximately 10 percent of the data was collected. At that time, a sensitivity analysis was performed to establish post-hoc trigger criteria.
Figure 1.5. Flow chart of the data reduction process.
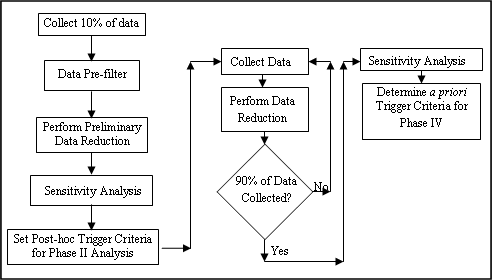
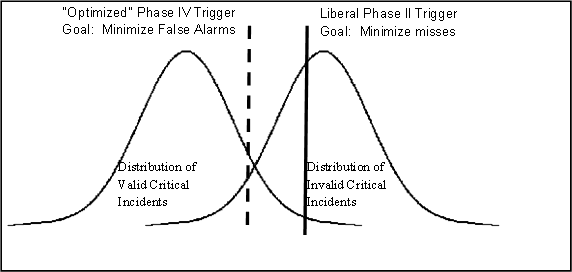
The sensitivity analysis was performed by setting the trigger criteria to a very liberal level, ensuring that the chance of a missed valid event was minimal while allowing a high number of invalid events (false alarms) to be identified (see Figure 1.6). Data reductionists then viewed all of the events produced from the liberal trigger criteria and classified each event as valid or invalid. The numbers of valid events and invalid events that resulted from this baseline setting were recorded.
Figure 1.6. Graphical depiction of trigger criteria settings for Phase II and Phase IV using the distribution of valid events. Note that this distribution and criterion placement is unique for each trigger type.
The trigger criteria for each dependent variable was then set to a slightly more conservative level and the resulting number of valid and invalid events was counted and compared to the first frequency count. The trigger criteria were made more and more conservative and the number of valid and invalid triggers counted and compared until an optimum trigger criteria value was determined (a level which resulted in a minimal amount of valid events lost and a reasonable amount of invalid events identified). The goal in this sensitivity analysis was to obtain a miss rate of less than 10 percent and a false-alarm rate of less than 30 percent. Therefore, the data reductionists would be presented with nearly all valid events but would have to reject less than 30 percent of the events that they reviewed. The list of dependent variables ultimately used as triggers used to identify crashes, near-crashes, and incidents is presented in Table 1.3.
Table 1.3. Dependent variables used as event triggers.
Trigger Type |
Description |
|---|---|
1. Lateral acceleration |
• Lateral motion equal to or greater than 0.7 g . |
2. Longitudinal acceleration |
• Acceleration or deceleration equal to or greater than 0.6 g . • Acceleration or deceleration equal to or greater than 0.5 g coupled with a forward TTC of 4 seconds or less. • All longitudinal decelerations between 0.4 g and 0.5 g coupled with a forward TTC value of = 4 seconds and that the corresponding forward range value at the minimum TTC is not greater than 100 ft. |
3. Event button |
• Activated by the driver by pressing a button located on the dashboard when an event occurred that he/she deemed critical. |
4. Forward time-to-collision |
• Acceleration or deceleration equal to or greater than 0.5 g coupled with a forward TTC of 4 seconds or less. • All longitudinal decelerations between 0.4 g and 0.5 g coupled with a forward TTC value of = 4 seconds and that the corresponding forward range value at the minimum TTC is not greater than 100 ft. |
5. Rear time-to-collision |
• Any rear TTC trigger value of 2 seconds or less that also has a corresponding rear range distance of = 50 feet and any rear TTC trigger value in which the absolute acceleration of the following vehicle is greater than 0.3 g. |
6. Yaw rate |
• Any value greater than or equal to a plus and minus 4-degree change in heading (i.e., vehicle must return to the same general direction of travel) within a 3-second window of time. |
Based on data from past VTTI studies, it was originally hypothesized that as many as 26 crashes, 520 near-crashes, and over 25,000 incidents (crash-relevant conflicts and proximity conflicts) would be collected. However many of these early estimates were based on long-haul-truck-driving data. It was soon discovered, after the sensitivity analysis process began that the variability in light-vehicle drivers’ braking, acceleration, and steering behavior is much larger than with truck drivers. These differences in variability are primarily due to the differences in vehicle dynamics and the more uniform driving skill of commercial truck drivers. While greater variability was expected for light-vehicle drivers, the high degree of variability that was observed was a very interesting result.
Given the variability in light-vehicle driving performance, the sensitivity analysis proved to be challenging. VTTI researchers determined that the best option was to accept a very low miss rate while accepting a fairly high false alarm rate to ensure that few valid events were missed. This resulted in viewing over 110,000 triggers in order to validate 9,125 events. The distribution of the total number of reduced events by severity is shown in Table 1.4.
Table 1.4. The total number of events reduced for each severity level.
Event Severity |
Total Number |
|---|---|
Crash |
69 |
Near-crash |
761 |
Incidents (Crash-relevant Conflicts and Proximity Conflicts) |
8,295 |
Once the trigger criteria were set, data reductionists watched 90-second epochs for each event (60 seconds prior to and 30 seconds after), reduced and recorded information concerning the nature of the event, driving behavior prior to the event, the state of the driver, the surrounding environment, etc. The specific variables recorded in the data reduction process are described in detail in the data reduction software framework section of this chapter.
Recruiting and Training Data Reductionists
Based upon past experience, it was estimated that reductionists would be able to complete an average of four events per hour. Fourteen data reductionists were recruited by posting flyers and sending notices to various graduate student listservs on the Virginia Tech campus. The data reduction manager interviewed, hired, and trained the data reductionists on how to access the data from the server and operate the data reduction software. Training was also provided on all relevant operational and administrative procedures (approximately 4 hours). The manager gave each data reductionist a data reduction manual to guide him or her in learning the software and reduction procedures. All analyst trainees practiced data reduction procedures with another trained analyst prior to reducing data independently. After each trainee felt comfortable with the process, the trainee worked alone under the supervision of the data reduction manager. Once the trainee and manager felt confident of the analyst’s abilities, the analyst began working independently with “spot check” monitoring from the project leader and other reductionists. The data reductionists were responsible for analyzing a minimum number of events per week and were required to attend weekly data reduction meetings to discuss issues that arose during the data reduction process.
The data reductionists performed two general tasks while creating the event database. On the first 10 to 15 percent of the data, they performed a preliminary data-reduction task in which they viewed events to determine whether the event was valid or invalid. If invalid, they then determined the severity of the event. After the trigger criteria was set using the results from the sensitivity analysis, the data reductionists validated the data, determined severity, and performed a full data reduction. For the full data-reduction process, they recorded all of the required variables (discussed below) for the event type.
Event Database Reduction Software Framework
The data reduction framework for the event database was developed to identify various driving behavior and environmental characteristics for four levels of event severity: crashes, near-crashes, crash-relevant conflicts, and proximity conflicts. The operational definitions for these severity levels are presented in Table 1.5. The variables recorded were selected based upon past instrumented-vehicle studies (Hanowski et al., 2000; Dingus et al., 2002), national crash databases (General Estimates System [GES] and Fatality Analysis Reporting System [FARS]), and questions on Virginia State Police accident reports. Using this technique, the reduced database can be used to directly compare crash data from GES and FARS to those crashes, near-crashes, and incidents (crash-relevant conflicts and proximity conflicts) identified in this dataset.
Table 1.5. Operational Definitions for All Event Severity Levels
Severity Level |
Operational Definition |
|---|---|
Crash |
Any contact with an object, either moving or fixed, at any speed in which kinetic energy is measurably transferred or dissipated. Includes other vehicles, roadside barriers, objects on or off of the roadway, pedestrians, cyclists, animals, etc. |
Near-Crash |
Any circumstance that requires a rapid, evasive maneuver by the subject vehicle, or any other vehicle, pedestrian, cyclist, or animal to avoid a crash. A rapid, evasive maneuver is defined as a steering, braking, accelerating, or any combination of control inputs that approaches the limits of the vehicle capabilities. |
Crash-Relevant Conflict |
Any circumstance that requires a crash-avoidance response on the part of the subject vehicle, any other vehicle, pedestrian, cyclist, or animal that is less severe than a rapid evasive maneuver (as defined above), but greater in severity than a normal maneuver to avoid a crash. A crash avoidance response can include braking, steering, accelerating, or any combination of control inputs. A normal maneuver for the subject vehicle is defined as a control input that falls outside of the 95 percent confidence limit for control input as measured for the same subject. |
Proximity Conflict |
Any circumstance resulting in extraordinarily close proximity of the subject vehicle to any other vehicle, pedestrian, cyclist, animal, or fixed object where, due to apparent unawareness on the part of the driver, pedestrians, cyclists, or animals, there is no avoidance maneuver or response. Extraordinarily close proximity is defined as a clear case where the absence of an avoidance maneuver or response is inappropriate for the driving circumstances (including speed, sight distance, etc.). |
The general method for data reduction was to have trained data reductionists view the video data and record the battery of variables for all valid events. The data reduction manager and project manager performed all data reduction on the near-crashes and crashes. Varying levels of detail were recorded for each type of event. Crash-relevant conflicts and proximity conflicts have the least amount of information recorded and near-crashes and crashes have the most information recorded. A total of four areas of data reduction were recorded for each event type. These four areas include: vehicle variables, event variables, environmental variables, and driver state variables. Table 1.6 defines each area of data reduction, provides examples, and describes additional features of the data reduction. The complete list of all variables reduced during data reduction is shown in Appendix C.
Table 1.6. Areas of data reduction, definition of the area, and examples.
Area of Data Reduction |
Definition |
Example |
|---|---|---|
Vehicle Variables |
All of the descriptive variables including the vehicle identification number, vehicle type, ownership, and those variables collected specifically for that vehicle, such as vehicle miles traveled (VMT). |
Vehicle ID, Vehicle type, Driver type (leased or private), and VMT. |
Event Variables |
Description of the sequence of actions involved in each event, list of contributing factors, and safety or legality of these actions. |
Nature of Event/ Crash type, Pre-event maneuver, Precipitating Factors, Corrective action/Evasive maneuver, Contributing Factors, Types of Inattention, Driver impairment, etc. |
Environmental Variables |
General description of the immediate environment, roadway, and any other vehicle at the moment of the incident, near-crash, or crash. Any of these variables may or may not have contributed to the event, near-crash or crash. |
Weather, ambient lighting, road type, traffic density, relation to junction, surface condition, traffic flow, etc. |
Driver's State |
Description of the instrumented-vehicle driver's physical state. |
Hands on wheel, seat belt usage, fault assignment, eyeglance, PERCLOS, etc. |
Driver/Vehicle 2 |
Description of the vehicle(s) in the general vicinity of the instrumented vehicle and the vehicle's action. |
Vehicle 2 body style, maneuver, corrective action attempted, etc. |
Narrative |
Written description of the entire event. |
|
Dynamic reconstruction |
Creation of an animated depiction of the event. |
|
The baseline database was comprised of approximately 20,000 6-second segments where the vehicle maintained a velocity greater than 5 mph (referred to as an epoch). Kinematic triggers on driving performance data were not used to select these baseline epochs. The epochs were selected at random throughout the 12- to 13-month data collection period per vehicle. A 6-second segment of time was used as this was the time frame used by data reductionists to ascertain whether a particular secondary task was a contributing factor for each crash, near-crash, and incident. For example, a driver had to take a bite of a sandwich 5 seconds prior to or 1 second after the onset of the conflict for the activity to be considered a contributing factor to the crash, near-crash, or incident.
Each baseline epoch was randomly selected from the 12-13 months of data collected on each vehicle. However, the number of baseline epochs selected per vehicle was stratified as a proportional sample based upon vehicle involvement in crashes, near-crashes, and incidents. This stratification, based on frequency of crash, near-crash, and incident involvement was conducted to create a case-control dataset in which multiple baseline epochs are present to compare to each crash and near-crash. Case-control designs are optimal for calculating odds ratios (also referred to as relative near-crash/crash risk) due to the increased power that a case-control data set possesses. Greenberg et al. (2001) argue that using a case-control design allows for an efficient means to study rare events, such as automobile crashes, even though smaller sample sizes are used. Given that relative near-crash/crash risk calculations were an objective of the following analyses, the creation of a case-control data set was deemed important.
Considering that the number of baseline epochs was dependent upon the number of crashes, near-crashes, and incidents of vehicle involvement, not driver involvement, an analysis was conducted to determine the percentage of events and baseline epochs that were attributable to the primary driver and secondary driver. The results indicated that 89.6 percent of all events and 88.2 percent of all baseline epochs were primary drivers. Therefore, even though the baselines were selected based upon vehicle involvement, the vast majority of crashes and near-crashes as well as baseline epochs were primary drivers.
Four vehicles did not have any crashes, near-crashes, or incidents and were therefore eliminated from the baseline database. The reasons that these four vehicles did not contain a single crash, near-crash, or incident included very low mileage due to driver attrition (2 vehicles), frequent mechanical malfunctions (1 vehicle), and excellent driver performance (1 vehicle).
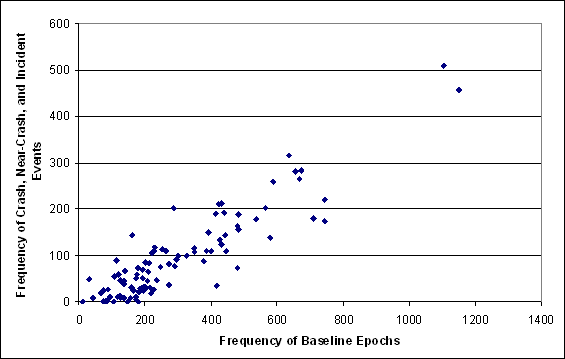
Figure 1.7 shows the number of events that each vehicle was involved (y-axis) and the corresponding number of baseline epochs that were identified for that vehicle (x-axis). Note that the vehicles that were involved in multiple crashes, near-crashes, and incidents also had a larger number of baseline epochs.
There are two data points on the far right side of the figure. These two data points represent two female drivers, 18 and 41 years of age, respectively. The 18-year-old female was involved in 3 crashes, 53 near-crashes, and 401 incidents. The 41-year-old female was involved in 4 crashes, 56 near-crashes, and 449 incidents. Both drivers were over-represented in their crash, near-crash and incident involvement.
Figure 1.7. The frequency of each vehicle’s involvement in crash, near-crash, and incident events versus the number of baseline epochs selected for each vehicle.
The baseline database will be used in the assessment of the prevalence of various types of inattentive driving. This will determine the relative near-crash/crash risk for each of these types of inattention as well as the percentage of crashes and near-crashes in the population that are attributable to these types of inattention. While the reader should keep in mind that the baseline epochs were stratified, this does not reduce the generalizability of the data analysis for the following reasons:
- 99 of 103 vehicles are represented in the 20,000 baseline epochs;
- 101 out of 109 primary drivers are represented in the baseline epochs;
- multiple drivers drove each vehicle; and
- no environmental or driver behavior data was used in the stratification.
The variables that were recorded for the 20,000 baseline epochs included vehicle, environmental, and most driver-state variables. In addition, eyeglance analyses were performed for 5,000 randomly selected baseline epochs from the 20,000 baseline epochs. These 5,000 baseline epochs also represent data from all 99 vehicles and 101 primary drivers.
The event variables (number 2 in Table 1.7) were not recorded for the baseline epochs as these variables (e.g., precipitating factor, evasive maneuver) were not present when an incident, near-crash, or crash did not occur. Table 1.7 shows the breakdown of the type of data that currently exists as part of the original 100-Car Study event database and the baseline database.
Table 1.7. Description of the databases created for the inattention analysis.
|
100-Car Study Event Database |
Baseline Database (epochs) |
|---|---|---|
1. |
Vehicle variables |
Vehicle variables |
2. |
Event variables |
N/A |
3. |
Environmental Variables |
Environmental Variables |
4. |
Driver-state Variables |
Driver-state Variables |
Eyeglance data (crashes, near-crashes, and incidents) |
Eyeglance data on 5,000 randomly selected baseline inattention events. |
|
|
Observer Rating of Drowsiness (ORD) for Crashes and Near-crashes |
Drowsiness was marked yes/no with yes = ORD of 60 or above. |
5. |
Driver/Vehicle 2 |
N/A |
10. |
Narrative |
N/A |
Data Reduction Inter- and Intra-Rater Reliability for the 100-Car Study Event Database
Training procedures were implemented to improve both inter- and intra-rater reliability given that data reductionists were asked to perform subjective judgments on the video and driving data. Reliability testing was then conducted to measure the resulting inter- and intra-rater reliability.
First, data-reductionist managers performed spot checks of the reductionists’ work, monitoring both event validity judgments as well as recording all database variables. Reductionists also performed 30 min of spot-checks of their own or other reductionists’ work every week. This was done to ensure accuracy but also to allow reductionists the opportunity to view other reductionists’ work. It was anticipated that this would encourage each reductionist to modify his or her own work and to improve consistency in decision-making techniques across all reductionists. Mandatory weekly meetings were held to discuss issues concerning data reduction techniques. Issues were usually identified by the spot-checking activities of the reductionist managers and the reductionists, or specific difficult events that the reductionists had encountered. These meetings provided iterative and ongoing reduction training throughout the entire data reduction process.
To determine how successful these techniques were, an inter- and intra-rater reliability test was conducted during the last 3 months of data reduction. Three reliability tests were developed (each containing 20 events) for which the reductionist was required to make validity judgments. Three of the 20 events were also completely reduced in that the reductionist recorded information for all reduction variables (i.e., event variables, driver-state variables, and environmental variables as opposed to simply marking severity of event). Three of the test events on Test 1 were repeated on Test 2 and three other events were duplicated between Tests 2 and 3 to obtain a measure of intra-rater reliability.
Using the expert reductionists’ evaluations of each epoch as a “gold” standard, the percent correct was calculated for each rater’s test. The measures for each rater for each testing period, along with a composite measure, can be found in Table 1.8.
Table 1.8. Percentage agreement with expert reductionists.
Rater |
Test 1 Percent |
Test 2 Percent |
Test 3 Percent |
|---|---|---|---|
1 |
78.3 |
87.5 |
91.3 |
2 |
65.2 |
70.8 |
78.3 |
3 |
100 |
91.7 |
95.7 |
4 |
100 |
91.7 |
87.0 |
5 |
100 |
83.3 |
87.0 |
6 |
95.7 |
87.5 |
91.3 |
7 |
91.3 |
87.5 |
91.3 |
8 |
91.3 |
91.7 |
91.3 |
9 |
95.7 |
70.8 |
91.3 |
10 |
95.7 |
91.7 |
87.0 |
11 |
95.7 |
87.5 |
100 |
12 |
78.3 |
87.5 |
87.0 |
13 |
87.0 |
83.3 |
96.0 |
14 |
78.3 |
83.3 |
91.3 |
|
Average |
88.4 |
|
The Kappa statistic was also used to calculate inter-rater reliability. Although there is controversy surrounding the usefulness of the Kappa statistic, it is viewed by many researchers as the standard for rater assessment (e.g., Cicchetti and Feinstein, 1990). The Kappa coefficient (K = 0.65, p <0.0001) indicated that the association among raters is significant. While the coefficient value is somewhat low, given the highly subjective nature of the task, the number of raters involved, and the conservative nature of this statistic, the Kappa calculation probably errs on the low side.
A tetrachoric correlation coefficient is a statistical calculation of inter-rater reliability based on the assumption that the latent trait underlying the rating scale is continuous and normally distributed. Based on this assumption, the tetrachoric correlation coefficient can be interpreted in the same manner as a correlation coefficient calculated on a continuous scale. The average of the pair-wise correlation coefficients for the inter-rater analysis is 0.86. The coefficients for the intra-rater analysis were extremely high with nine raters achieving a correlation of 1.0 among the three reliability tests and five raters achieving a correlation of 0.99.
Given these three methods of calculating inter-rater reliability, it appears that the data reduction training coupled with spot-checking and weekly meetings proved to be an effective method for achieving high inter- and intra-rater reliability.
Baseline Database
Inter-rater reliability tests were also conducted for the baseline events. All trained data reductionists were given a random sample of 25 baseline epochs to view and record the secondary tasks, driving-related inattention behaviors, and moderate to severe drowsiness. The reductionists’ responses were then compared to an expert data reductionist’s responses. The results indicated an average of 88 percent accuracy among all the data reductionists. Given that the Kappa coefficient and the tetrachoric correlation coefficient did not provide additional information, these tests were not conducted on the baseline inter-rater reliability test.
SURVEYS, QUESTIONNAIRES AND PERFORMANCE-BASED TESTS
As part of the 100-Car Study, the primary drivers were administered questionnaires and performance-based tests either prior to data collection or post data collection (dependent upon the type of test). Table 1.9 provides a list and description of each type of questionnaire and performance-based test that was completed. A copy of all questionnaires and surveys is located in Appendix B.
Table 1.9. Description of questionnaire and computer-based tests used for the 100-Car Study.
|
Name of Testing Procedure |
Type of Test |
Time test was administered |
Brief description |
|---|---|---|---|---|
1. |
Driver demographic information |
Paper/pencil |
In-processing |
General information on drivers age, gender, etc. |
2. |
Driving History |
Paper/pencil |
In-processing |
General information on recent traffic violations and recent collisions. |
3. |
Health assessment questionnaire |
Paper/pencil |
In-processing |
List of variety of illnesses/medical conditions/or any prescriptions that may affect driving performance. |
4. |
Dula Dangerous Driving Index |
Paper/pencil |
In-processing |
One score that describes driver's tendencies toward aggressive driving. |
5. |
Sleep Hygiene |
Paper/pencil |
In-processing |
List of questions that provide information about driver's general sleep habits/substance use/sleep disorders. |
6. |
Driver Stress Inventory |
Paper/Pencil |
In-processing |
One score that describes the perceived stress levels drivers experience during their daily commutes. |
7. |
Life Stress Inventory |
Paper/pencil |
In-processing/Out-processing |
One score that describes drivers stress levels based upon the occurrence of major life events. |
8. |
Useful Field-of-View |
Computer-based test |
In-processing |
Assessment of driver's central vision and processing speed, divided and selective attention. |
9. |
Waypoint |
Computer-based test |
In-processing |
Assessment of the speed of information processing and vigilance. |
10. |
NEO-FFI |
Paper/pencil |
In-processing |
Personality test. |
11. |
General debrief questionnaire |
Paper/pencil |
Out-processing |
List of questions ranging from seatbelt use, driving under the influence, and administration of experiment. |