CHAPTER 2: OBJECTIVE 1, WHAT IS THE PREVALENCE AS WELL AS THE TYPES OF DRIVER INATTENTION IN WHICH DRIVERS ENGAGE DURING THEIR DAILY DRIVING? WHAT IS THE RELATIVE NEAR-CRASH/CRASH RISK OF DRIVING WHILE ENGAGING IN AN INATTENTIVE TASK? IS THE RELATIVE NEAR-CRASH/CRASH RISK DIFFERENT FOR DIFFERENT TYPES OF SECONDARY TASKS?
During data reduction it became apparent that there were many rear-end and run-off-road collisions that occurred primarily because the driver looked away from the forward roadway at a critical point. In order to conduct defined analyses on these events, separate categories of driver inattention were developed. Throughout this document, driver inattention is broadly defined as any point in time that a driver engages in a secondary task, exhibits symptoms of moderate to severe drowsiness, or looks away from the forward roadway. These categories of driver inattention are operationally defined as follows.
- Secondary task distraction – driver behavior that diverts the driver’s attention away from the driving task. This may include talking/listening to hand-held device, eating, talking to a passenger, etc. A complete list of all secondary task distractions is provided in Appendix A.
- Driving-related inattention to the forward roadway – driver behavior that is directly related to the driving task but diverts driver’s attention away from the forward field of view. This includes reductionists observing drivers checking the speedometer, checking blind spots, observing adjacent traffic prior to or during a lane change, looking for a parking spot, and checking mirrors.
- Drowsiness – driver behavior that includes eye closures, minimal body/eye movement, repeated yawning, and/or other behaviors based upon those defined by Wierwille and Ellsworth (1994).
- Non-specific eyeglance away from the forward roadway – driver behavior that includes moments when the driver glances, usually momentarily, away from the roadway, but at no discernable object, person, or unknown location. Eyeglance reduction and analysis of these events was done for crashes, near-crashes, incidents, and 5,000 of the baseline events.
The terms driver inattention and driver distraction have been used throughout the transportation literature separately at times and interchangeably at other times, referring to different types of driver inattention. In this report, the term driver inattention will refer to a broader scope of behaviors as defined above. The term driver distraction, when used, will refer only to secondary-task engagement.
The frequency of occurrence, the relative near-crash/crash risk, and population attributable risk percentage for each of these associated types of inattention will be determined in this chapter.
Driver Data Included in the Analysis
For the analyses in this chapter, crashes and near-crashes only will be used (incidents will be excluded from the analyses). In Chapter 6, Objective 2 of the 100-Car Study Final Report, the analyses indicated that the kinematic signatures of both crashes and near-crashes were nearly identical; whereas the kinematic signature of incidents was more variable. Given this result and the need to increase statistical power, the data from both crashes and near-crashes will be used in the calculation of relative risk.
Please note that secondary tasks, driving-related inattention to the forward roadway, and drowsiness were all recorded for crash and near-crash events as well as baseline epochs. Eyeglance data, on the other hand, was recorded for all events and 5,000 of the baseline epochs (25 percent of the baseline epochs). Therefore, all analyses that are conducted requiring eyeglance data will use only the 5,000 baseline epochs. All other analyses utilize the entire baseline database. Please note that the 5,000 baseline epochs that contain eyeglance data also represent 99 vehicles and 101 primary drivers which is identical to the number of vehicles and primary drivers represented in all 20,000 baseline epochs.
Recall from Chapter 1 that the baseline database consisted of a stratified random sample of epochs. This stratification was performed to provide a case-control data set which possesses greater statistical power for the calculation of relative near-crash/crash risk.
QUESTION 1. WHAT IS THE RELATIVE FREQUENCY OF A DRIVER BEING LABELED INATTENTIVE VERSUS ATTENTIVE?
To determine the relative frequency of inattention, the baseline epochs were analyzed to assess the frequency in which drivers were engaging in inattention-related tasks during normal, baseline driving. While task duration was not recorded, the fact that 73 percent of all 6-second segments contained at least one form of driving inattention indicates that drivers are engaging in secondary tasks, driving while drowsy, or looking away from the forward roadway very frequently.
QUESTION 2. WHAT IS THE RELATIVE FREQUENCY OF EACH TYPE OF DRIVER INATTENTION BEING LABELED AS A CONTRIBUTING FACTOR FOR CRASHES, NEAR-CRASHES, AND/OR PRESENT IN BASELINE EPOCHS?
Two comparisons were performed on different subsets of data. First, a comparison was conducted of the four types of inattention for the crashes and near-crashes versus the 5,000 baseline epochs . Second, a separate comparison of three types of inattention, secondary task, drowsiness, and driving-related inattention to the forward roadway , for all 20,000 baseline epochs and crashes and near-crashes was conducted to assess the frequency analysis for the entire dataset.
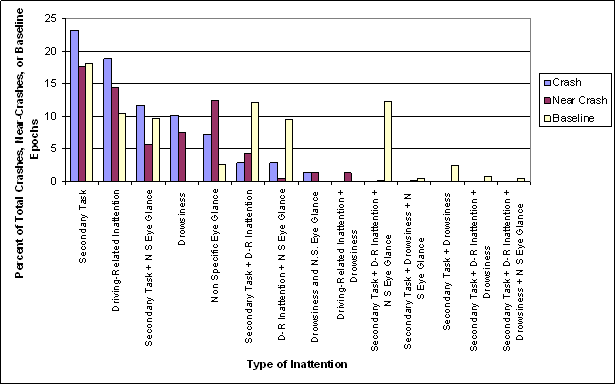
Figure 2.1 shows the percentage of the total number of crashes, near-crashes, and baseline epochs that were inattention-related. Please note that 78 percent of all crashes, 65 percent of all near-crashes, and 73 percent of all 20,000 baseline epochs contained at least one of the four types of inattention. Therefore, the sum of all of the bars representing crashes is equal to 78.
Each event and epoch is presented in the figure by type of inattention and/or combination of inattention because many of the events and epochs contained multiple types of driving inattention. Please note that s econdary task, driving-related inattention , and driver drowsiness were the most frequent contributing factors for the crashes and near-crashes. Also note that secondary task and combinations thereof were the most frequent types of inattention observed for baseline epochs. Drowsiness occurred far less frequently for the baseline epochs than for the crashes and near-crashes. The non-specific eyeglance category occurred most frequently in conjunction with secondary tasks and driving-related inattention , and only accounted for an additional 2 percent of the baseline epochs by itself.
Figure 2.1 shows that non-specific eyeglance most commonly occurred in conjunction with other sources of driver inattention for the baseline epochs. For crashes and near-crashes, there were higher percentages of events where non-specific eyeglance , by itself, was a contributing factor. This result will be more fully analyzed later in this chapter.
Figure 2.1. The percentage of the total number of crashes and near-crashes identified in the 100-Car Study and the percentage of the total number of baseline epochs in which these four types of inattention were identified as a contributing factor (N = 69 crashes, 761 near-crashes, and 4,977 baseline epochs).
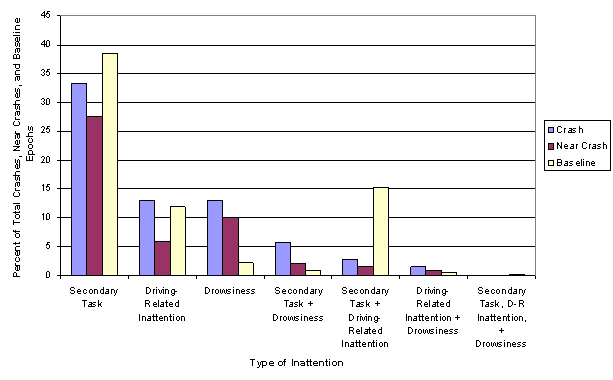
Comparisons were then conducted without the non-specific eyeglance inattention category for crashes, near-crashes, and baseline epochs to obtain a complete picture of the frequency of inattention categories for all 20,000 baseline epochs. Without non-specific eyeglance , the combinations of inattention-type are fewer. For example, the secondary task plus non-specific eyeglance category in Figure 2.1 is now included with the secondary task category in Figure 2.2. Secondary tasks are still the most frequent type of inattention for crashes and near-crashes, followed by driving-related inattention to the forward roadway and drowsiness .
Note that the baseline epochs are similar to crashes and near-crashes in that secondary tasks are again the most frequent; followed by driving-related inattention to the forward roadway and combinations of these two types of inattention. Drowsiness, however, was observed in less than 2.2 percent of all baseline epochs. This is a very interesting finding when comparing drowsiness's low baseline-epoch percentage to the much higher percentage in crashes and near-crashes. This may indicate that driver drowsiness may significantly increase near-crash/crash risk. Also of interest is the high frequency of driving-related inattention to the forward roadway for the baseline epochs. This category is present in 27 percent (summed across categories) of the baseline epochs but only 14 percent of the crashes and near-crashes. In this case, relative near-crash/crash risk due to driving-related inattention to the forward roadway may be very low. Odds ratios will be presented for all types of inattention in the next section.
Figure 2.2. The percentage of crashes and near-crashes in which three types of inattention were identified as a contributing factor (N = 69 crashes, 761 near-crashes, and 19,827 baseline epochs).
QUESTION 3. DETERMINE THE RELATIVE NEAR-CRASH/CRASH RISK AND THE POPULATION ATTRIBUTABLE RISK PERCENTAGE FOR EACH TYPE OF INATTENTION. WHAT IS THE RELATIVE RISK FOR DIFFERENT TYPES OF SECONDARY TASKS?
Using the baseline data as a measure of non-event exposure, odds ratios were calculated to obtain an estimate of relative near-crash/crash risk for each of the four types of inattention. In addition, population attributable risk percentages were calculated to determine the percentage of crashes and near-crashes that occur in the general driving population when inattention was a contributing factor.
Both statistics are used because of the complementary information that both provide. While the odds ratio, or relative risk calculation for a crash or near-crash, provides information regarding individual near-crash/crash risk when engaging in a particular behavior, the population attributable risk percentage calculation provides an estimate of the percentage of crashes and near-crashes in the study population that can be attributed to each type of behavior. Therefore, while an individual’s near-crash/crash risk may increase while performing a particular task, drivers may not engage in this behavior very often or the behavior requires a brief duration therefore very few crashes in the population are in fact caused by this behavior. On the other hand, if a specific type of behavior does not increase individual near-crash/crash risk greatly in isolation, this behavior may in fact occur frequently and/or for long durations while driving and therefore does account for many crashes in the population.
The following odds ratios are calculated for three levels of secondary tasks , two levels of driving-related inattention , two levels of non-specific eyeglances , and only one level of drowsiness . The three levels of secondary tasks are complex secondary tasks , moderate secondary tasks , and simple secondary tasks . The complex secondary tasks are defined as a task that requires either multiple steps, multiple eyeglances away from the forward roadway, and/or multiple button presses (Dingus, Antin, Hulse, and Wierwille, 1989). Moderate secondary tasks are those that require, at most, two glances away from the roadway and/or at most two button presses. Simple secondary tasks are those that require none or one button press and/or one glance away from the forward roadway. Table 2.1 presents the task types that were assigned to each level of complexity. For operational definitions and examples for each of these tasks, please refer to Appendix C.
Table 2.1. Assignment of secondary tasks into three levels of manual/visual complexity.
Simple Secondary Tasks |
Moderate Secondary Tasks |
Complex Secondary Tasks |
|---|---|---|
1. Adjusting radio |
1. Talking/listening to hand-held device |
1. Dialing a hand-held device |
2. Adjusting other devices integral to the vehicle |
2. Hand-held device-other |
2. Locating/reaching/ answering hand-held device |
3. Talking to passenger in adjacent seat |
3. Inserting/retrieving CD |
3. Operating a PDA |
4. Talking/Singing: No passenger present |
4. Inserting/retrieving cassette |
4. Viewing a PDA |
5. Drinking |
5. Reaching for object (not hand-held device) |
5. Reading |
6. Smoking |
6. Combing or fixing hair |
6. Animal/object in vehicle |
7. Lost in Thought |
7. Other personal hygiene |
7. Reaching for a moving object |
8. Other |
8. Eating |
8. Insect in vehicle |
|
9. Looking at external object |
9. Applying makeup |
There is considerable automotive research indicating that drivers generally do not look away from the forward roadway greater than 1.0 to 1.5 seconds per glance (Wierwille, 1993). Tasks that require longer and more frequent glances decrease safe driving performance. Therefore, the driving-related inattention to the forward roadway category, which is operationally defined as eyeglances to one of the rear-view mirrors or windows, was separated into two categories: total time eyes off the forward roadway: greater than 2 seconds and less than 2 seconds. The same distinction was used for non-specific eyeglances away from the forward roadway . These two inattention categories were separated in this manner to differentiate those short, quick glances that are characteristic of an alert driver scanning his or her environment compared to those drivers who are looking away from the forward roadway longer than a short-duration glance.
This separation of the general categories of inattention was performed since there are many factors present within these categories and an odds-ratio calculation for the entire category of secondary task , all durations of driving-related inattention to the forward roadway , or all durations of non-specific eyeglance would provide misleading information and would not be as useful.
The baseline data was categorized in the same manner, using three levels of secondary task , two levels of driving-related inattention , and two levels of non-specific eyeglance data. Due to the importance of glance length, eyeglance data was required for the separation of driving-related inattention to the forward roadway and non-specific eyeglance . Therefore, only the 5,000 baseline epochs that contained eyeglance data were used to calculate these odds ratios.
When the frequency counts were conducted for the baseline data, 76 combinations emerged from these eight levels of inattention. These combinations emerged because drivers were eating chips ( moderate secondary task ) and would check their left rear-view mirrors for 0.5 seconds ( driving-related inattention less than 2 seconds ), for example. Very few combinations emerged for the crash and near-crash events. Odds ratios were not calculated for each combination of inattention type as the frequency counts were very low in most instances (resulting in wide confidence limits). Odds ratios were calculated for drowsiness as well as drowsiness combined with other types of inattention as the correlations between drowsiness and other types of inattentive behavior are less compelling than the correlations between secondary task engagement, driving-related inattention to the forward roadway, and non-specific eyeglance .
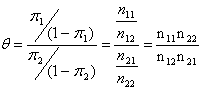
Definition of an Odds Ratio Calculation. A commonly used measure of the likelihood of event occurrence is termed as the odds. The odds measure the frequency of event occurrence (i.e., presence of inattention type) to the frequency of event non-occurrence (i.e., absence of inattention type). That is, the odds of event occurrence are defined as the probability of event occurrence divided by the probability of non-occurrence. The 2x2 contingency table in Table 2.2 will be used to illustrate this and related measures.
Table 2.2. An example of a 2x2 contingency table that would be used to calculate inattention-related odds ratios.
|
Inattention Present |
No Inattention Present |
|
|---|---|---|---|
Reduced Event |
n 11 |
n 12 |
n 1. |
Baseline Event |
n 21 |
n22 |
n 2. |
|
n .1 |
n.2 |
n.. |
If the probability of success (inattention present) for the first row of the table is denoted by π1 = n11/n1. and the probability of failure (no inattention present) is defined as (1 –π1) = n12/n1., then the odds of success is defined as π1/(1-π1) = n11/n12. The odds of success for the second row are defined similarly with the corresponding success probability, π2.
The ratio of the odds is a commonly employed measure of association between the presence of cases (crash and near-crash events) and the controls (baseline driving epochs). Odds ratios are used as an approximation of relative near-crash/crash risk in case control designs. This approximation is necessary due to the separate sampling employed for the events and baselines and is valid for evaluations of rare events. (Greenberg et al., 2001). Referring to Table 2.2, the odds ratio would be defined as:
 |
Equation 2.1 |
and is a comparison of the odds of success in row 1 versus the odds of success in row 2 of the table.
Algebraically, this equation can be rewritten as shown below. Basic odds ratios are calculated as shown in Equation 2.2.
| Odds Ratio = (A x D)/(B x C) | Equation 2.2 |
Where:
A = the number of at-fault* events where <inattention type> was present without any other type of inattention
B = the number of at-fault* events where drivers were attentive
C = the number of baseline epochs where <inattention type> was present without any other type of inattention
D = the number of baseline epochs where drivers were attentive
*At-fault was assessed by the data reductionists to indicate whether the driver’s actions were primarily the cause of the crash or near-crash or whether the driver was simply reacting to another vehicles poor driving performance. Only those crashes and near-crashes that the reductionists deemed to be the fault of the driver of the instrumented vehicle were included in these analyses.
To interpret odds ratios, a value of 1.0 indicates no significant danger above normal, baseline driving. An odds ratio less than 1.0 indicates that this activity is safer than normal, baseline driving or creates a protective effect. An odds ratio greater than 1.0 indicates that this activity increases one’s relative risk of a crash or near-crash by the value of the odds ratio. For example, if reading while driving obtained an odds ratio of 3.0, then this indicates that a driver is three times more likely to be involved in a crash or near-crash while reading and driving than if he or she was just driving normally.
Results of Odds Ratio Calculations. The odds ratio calculations were initially conducted for driving-related inattention to determine whether this behavior increases near-crash/crash risk or is a typical behavior of an alert driver (i.e., does not impact near-crash/crash risk). The odds ratios for driving-related inattention to the forward roadway less than 2 seconds and greater than 2 seconds are presented in Table 2.3. Note that both odds ratios are significantly less than 1.0 suggesting that this behavior is actually protective in that drivers who are engaging in this behavior are safer than those drivers who are simply driving (i.e., not engaging in any extra type of behavior). Given this result, driving-related inattention to the forward roadway will no longer be included in the operational definition of driving inattention for the remainder of this report.
Table 2.3. Odds ratio point estimates and 95-percent confidence limit intervals to assess likelihood of at-fault-crash (N = 49) or near-crash (N = 439) involvement in driving-related inattention to the forward roadway.
Type of Inattention |
Odds Ratio |
Lower CL |
Upper CL |
|---|---|---|---|
Driving-Related Inattention to the Forward Roadway Greater than 2 seconds |
0.45 |
0.24 |
0.83 |
Driving-Related Inattention to the Forward Roadway Less than 2 seconds |
0.23 |
0.15 |
0.34 |
Table 2.4 shows the odds ratio calculations as well as the upper and lower confidence levels for the remaining three types of inattention: drowsiness , secondary task , and non-specific eyeglance . Drowsiness , drowsiness (all combinations) , moderate secondary tasks, and complex secondary tasks obtained odds ratios of 6.2, 4.2, 2.1, and 3.1 respectively. This result suggests that drivers who drive while severely drowsy are between 4.5 and 8.5 times as likely to be involved in a crash or near-crash as alert drivers. Drivers who are engaging in moderate secondary task s are between 1.6 and 2.7 times as likely to be involved in a crash or near-crash, and drivers engaging in complex secondary tasks are between 1.7 and 5.5 times as likely. The odds ratio for simple secondary task s was also greater than 1.0, however, the lower confidence limit was less than 1.0, indicating these tasks do not significantly alter the likelihood of crash or near-crash involvement over that of normal, baseline driving. The odds ratios for non-specific eyeglance - greater than 2 seconds and less than 2 seconds obtained an odds ratios less than 1 (OR = 0.9 and 0.4) but were also not significantly different than 1.0 (as indicated by the upper and lower confidence limit containing 1.0). This result indicates that these types of eyeglance behaviors are probably just as safe as normal, baseline driving. While they may be just as safe, these eyeglance behaviors do not reduce the likelihood of being involved in a crash or near-crash as do eyeglances to mirrors or checking traffic through windows. Note that all odds ratios that are significantly different than 1.0 are in bold font.
Table 2.4. Odds ratio point estimates and 95% confidence intervals to assess likelihood of at-fault crash (N = 49) or near-crash (N = 439) involvement when engaging in driving inattention.
Type of Inattention |
Odds Ratio |
Lower CL |
Upper CL |
|---|---|---|---|
Complex Secondary Task |
3.10 |
1.72 |
5.47 |
Moderate Secondary Task |
2.10 |
1.62 |
2.72 |
Simple Secondary Task |
1.18 |
0.88 |
1.57 |
Moderate to Severe Drowsiness (in isolation from other types of inattention) |
6.23 |
4.59 |
8.46 |
Moderate to Severe Drowsiness (all occurrences) |
4.24 |
3.27 |
5.50 |
Non-specific Eye Glance Away from the Forward Roadway-Greater than 2 seconds |
0.85 |
0.20 |
3.65 |
Non-specific Eye Glance Away from the Forward Roadway-Less than 2 seconds |
0.43 |
0.17 |
1.06 |
Note: These calculations included frequency of events/epochs that included the type of inattention by itself and not in combination with other types of inattention. Only moderate to severe drowsiness (combination) took into account all events in which drowsiness was a contributing factor regardless of whether another type of inattention was present. Five thousand baseline epochs were used along with all crashes and near-crashes where the driver was at fault.
Table 2.5 provides the odds ratios for each type of secondary task separately. Given that these odds ratios are not dependent upon glance length, all 20,000 baseline epochs were used for these calculations. Also, frequencies were counted when each type of secondary task was present, either alone or in combination with other types of inattention. This modification was conducted due to low statistical power associated with breaking data into smaller subsets. While there were over 40 secondary tasks that were identified by the data reductionists, only those secondary tasks that were observed for crashes and near-crashes as well as baseline epochs will be presented in the table. In other words, some secondary tasks were not observed for either the events or baseline epochs, therefore it was not possible to calculate an odds ratio. Those odds ratios that are significantly different than 1.0 are shown in bold font.
As can be viewed from this table, half of the secondary tasks have odds ratios greater than 1.0. Reaching for a moving object was shown to have the highest odds ratio followed by external distraction, reading, applying makeup, and dialing a hand-held device . Please note that handling a CD, talking or listening to a hand-held device, an insect in the vehicle , and reaching for an object (not moving) also had odds ratios greater than 1.0 but their lower confidence limits went below 1.0, indicating that these secondary tasks may not actually increase the likelihood of crash or near-crash involvement.
The odds ratio for passenger in adjacent seat was also significantly different from 1.0; however, it was significantly lower than 1.0 indicating that it is actually safer to have a passenger in the vehicle than to drive alone. This may be because passengers are often also scanning the environment for hazards and may alert the driver to a hazard that he or she may have missed.
Table 2.5. Odds ratios point estimates and 95 percent conflict confidence intervals to assess the likelihood of crash (N= 49) or near-crash (N = 439) involvement when engaging in secondary tasks.
Type of Secondary Task |
Odds Ratio |
Lower CL |
Upper CL |
|---|---|---|---|
Reaching for a moving object |
8.82 |
2.50 |
31.16 |
Insect in Vehicle |
6.37 |
0.76 |
53.13 |
Looking at external object |
3.70 |
1.13 |
12.18 |
Reading |
3.38 |
1.74 |
6.54 |
Applying makeup |
3.13 |
1.25 |
7.87 |
Dialing hand-held device |
2.79 |
1.60 |
4.87 |
Inserting/retrieving CD |
2.25 |
0.30 |
16.97 |
Eating |
1.57 |
0.92 |
2.67 |
Reaching for non-moving object |
1.38 |
0.75 |
2.56 |
Talking/listening to a hand-held device |
1.29 |
0.93 |
1.80 |
Drinking from open container |
1.03 |
0.33 |
3.28 |
Other personal hygiene |
0.70 |
0.33 |
1.50 |
Adjusting radio |
0.55 |
0.13 |
2.22 |
Passenger in adjacent seat |
0.50 |
0.35 |
0.70 |
Passenger in rear seat |
0.39 |
0.10 |
1.60 |
Combing hair |
0.37 |
0.05 |
2.65 |
Child in rear seat |
0.33 |
0.04 |
2.40 |
Note: Calculation included frequency of events/epochs that included the type of inattention by itself or in combination with other types of inattention. Twenty thousand baseline epochs were used along with all crashes and near-crashes where the driver was at fault.
All drivers in the present study were over the age of 18; however, there were 16 drivers between 18 and 20 years old. A second odds ratio was calculated to assess whether the presence of passengers were not protective for this younger age group. These odds ratios are presented in Table 2.6. The results suggest that the odds ratios for the 18- to 20-year-olds is nearly the same as it is for the drivers who are 20 years of age and older. This result is consistent with research findings by Williams (2003) where 16- to 17-year-old drivers’ near-crash/crash risk increased with the number of passengers in the vehicle up to six times that of normal, baseline driving, 18- to 19-year-old drivers showed a very slight increase in near-crash/crash risk, and older drivers demonstrated a protective effect for the presence of passengers.
Table 2.6. Odds ratio calculations and 95 percent confidence intervals for “Passenger Present” for drivers who are younger and older than 20 years of age.
Age Group |
Odds Ratio for Passenger Present |
Lower CL |
Upper CL |
|---|---|---|---|
18 to 20 Years of Age |
0.53 |
0.33 |
0.83 |
Older than 20 Years |
0.58 |
0.39 |
0.87 |
Definition of Population Attributable Risk. For those types of inattention with an odds ratio greater than 1.0, population attributable risk percentages (PAR%) were also calculated. This calculation provides an assessment of the percentage of crashes and near-crashes that are occurring in the population at-large that are directly attributable to the specific behavior measured. This is an excellent counterpart to the odds ratio calculation in that the odds ratio is measured at the individual level whereas the population attributable risk percentage is measured at the population level or for all drivers in the population. Please note that data was collected in only a metropolitan area, thus, some degree of caution should be exercised in the interpretation of these results to the population at large.
Population attributable risk percentage is calculated as follows:
| PAR% = [(Pe (OR – 1))/(1 + Pe (OR – 1))] * 100 | Equation 2.3 |
Where Pe = population exposure estimate
OR = odds ratio or relative risk estimate for a crash or near-crash
For example, to assess a population attributable risk percentage for complex secondary tasks, the population exposure estimate was calculated by counting the number of baseline epochs where a complex secondary task was present and counting the total number of baseline epochs in equation (# of baseline epochs with complex secondary tasks present + # of baseline epochs where no type of inattention was present), for example:
Pe = 49 baseline epochs with complex secondary tasks/2,273 total baseline epochs = 0.02
The relative risk or odds ratio of a crash or near-crash, as shown in Table 2.4, indicated that the relative risk for complex secondary tasks was 3.10. Thus, the PAR percent was calculated as follows:
PAR% = [(0.02) (3.10 – 1.00)/1.00 + (0.02) (3.10 – 1.00))]*100 = 4.3
For a more complete discussion of the population attributable risk percentage calculations, see Sahai and Khurshid (1996), Statistics in Epidemiology.
Results of Population Attributable Risk Percentage Calculations. The population attributable risk percentage calculations are presented in Table 2.7 for all of those types of inattention and secondary tasks with an odds ratio greater than 1.0. A population attributable risk percentage calculation is not applicable to those sources of inattention with an odds ratio of less than 1.0.
The results indicate that moderate to severe drowsiness accounts for between 22 and 24 percent of all crashes and near-crashes, and c omplex, moderate, and simple secondary tasks account for 23 percent of all crashes and near-crashes. Dialing a hand-held device, talking on a hand-held device , and reading all contributed to 3.6 percent, 3.6 percent, and 2.9 percent to all crashes and near-crashes, respectively. Interestingly, dialing a hand-held device had an odds ratio of 2.8 whereas talking/listening to hand-held device had an odds ratio of 1.3 and was not significantly different than 1.0. These two secondary tasks had nearly the identical population attributable risk percentages. One hypothesis for this is that drivers were talking/listening to hand-held devices a much larger percentage of time than they were dialing hand-held devices. Thus, the percent of crashes and near-crashes that were attributable to these two actions was similar due to the fact that dialing was more dangerous but was performed less frequently whereas talking/listening was less dangerous but done more frequently. The rest of the secondary tasks each accounted for less than 3 percent of all crashes and near-crashes. In total, drowsiness and secondary task engagement are contributing factors in over 45 percent of all crashes and near-crashes.
Table 2.7. Population attributable risk percentage point estimates and 95 percent confidence intervals for types of inattention and the specific secondary tasks.
Type of Inattention |
Population Attributable Risk Percentage (PAR%) |
Lower CL |
Upper CL |
|---|---|---|---|
Complex Secondary Task |
4.26 |
3.95 |
4.57 |
Moderate Secondary Task |
15.23 |
14.63 |
15.83 |
Simple Secondary Task |
3.32 |
2.72 |
3.92 |
Moderate to Severe Drowsiness (in isolation from other types of inattention) |
22.16 |
21.65 |
22.68 |
Moderate to Severe Drowsiness (all occurrences) |
24.67 |
21.12 |
25.23 |
Reaching for moving object in vehicle |
1.11 |
0.97 |
1.25 |
Insect in vehicle |
0.35 |
0.27 |
0.44 |
Reading |
2.85 |
2.60 |
3.10 |
Dialing hand-held device |
3.58 |
3.29 |
3.87 |
Applying Makeup |
1.41 |
1.23 |
1.59 |
Looking at external object |
0.91 |
0.77 |
1.05 |
Inserting/retrieving CD |
0.23 |
0.15 |
0.32 |
Eating |
2.15 |
1.85 |
2.46 |
Reaching for non-moving object |
1.23 |
0.96 |
1.50 |
Talking/listening to hand-held Device |
3.56 |
3.10 |
4.10 |
Drinking from open container |
0.04 |
-0.10 |
0.18 |
Please note that the population attributable risk percentages of the individual secondary tasks do not sum to the higher level secondary-task categories. Recall that there are other types of secondary tasks that are being calculated for each general level of secondary task. For example, the sum of the population attributable risk percentages for the individual types of secondary tasks will not add up to the population attributable risk percentage for the complex secondary task type.
The results from these analyses demonstrate the power of large-scale naturalistic driving studies in that the prevalence of driving inattention, the frequency of occurrence, as well as the relative near-crash/crash risk for various types of driver inattention can finally be assessed using pre-crash driving behavior data. While relative risk calculations for a crash or near-crash have been obtained using survey data and/or police accident reports, this study directly observed drivers prior to crashes and near-crashes and compare this behavior to their driving behaviors during normal, routine driving.
To calculate the prevalence and frequency of driver inattention, the baseline driving database was used. This analysis indicated that drivers engaged in one of four types of inattention in over 70 percent of the 20,000 baseline epochs. Interestingly, secondary task engagement accounted for 54 percent, driving-related inattention to the forward roadway accounted for 27 percent, and drowsiness only accounted for 4 percent of the baseline epochs.
The results of these analyses indicated that all odds ratios for each of the secondary task types indicated that reaching for a moving object, looking at an external object (i.e., long glance), reading, applying makeup, dialing a hand-held device, and eating all had odds ratios greater than 1.0. This suggests a higher individual near-crash/crash risk when a driver engages in these activities. Interestingly, driving with a passenger , singing to the radio , and even some engagement with the radio and the heating/air conditioner unit all resulted in odds ratios less than 1.0. These results most likely suggest that these activities are indicative of a relatively alert driver. For drivers over the age of 18, having a passenger in the vehicle is associated with less likelihood of crash or near-crash involvement than if there was no passenger in the vehicle. A possible interpretation of this result is that the passenger is also scanning the environment and can warn a driver of an impending dangerous situation. Please note that there is a substantial body of research on drivers under the age of 18 indicating that passengers in the vehicle actually increase near-crash/crash risk. The results from this study should not be interpreted as conflicting with results from the teen-driving research. There were no 16- or 17-year-old drivers in this study and therefore, the data can not be applied to the teenage driving population.
Even though the odds ratios for reaching for a moving object, external distraction, reading, applying makeup, and eating presented greater individual near-crash/crash risk, these factors did not account for a large percentage of actual crashes and near-crashes in an urban population as shown by the population attributable risk percentage calculations. Drowsiness, on the other hand, attributed to between 22 and 24 percent of the crashes and near-crashes in the population, which is much higher than most crash database research has shown (Campbell, Smith, and Najm, 2003). All complexity levels of secondary tasks attributed to 22 percent of the crashes and near-crashes in an urban environment. In total, inattention contributes to over 45 percent of all crashes and near-crashes that occur in an urban environment.
Also of interest was that dialing a hand-held device had an odds ratio of approximately 3.0 whereas talking/listening to hand-held device had an odds ratio of slightly over 1.0 and was not significantly different than 1.0. These two secondary tasks had nearly the identical population attributable risk percentages (each attributing to 3.6 percent of crashes and near-crashes). One hypothesis for this is that drivers were talking/listening to hand-held devices a much larger percentage of time than they were dialing hand-held devices. Thus, the percent of crashes and near-crashes that were attributable to these two actions was similar due to the fact that dialing was more dangerous but was performed less frequently whereas talking/listening was less dangerous but performed more frequently.